Showing posts with label KNM. Show all posts

Thursday, March 31, 2011

JCY, Axiata, KNM

Despite the KLCI marked a 30 months new high, many counters are still falling while some even makes new low. Therefore, this shows that the recent rally is rather selectively on some heavy weighted index components while the overall market is not as much bullish.

Revision of Last week's Case Study: JCY - 5161: New Low again.


Chart 1: JCY - 5161 (11/05/2010 ~ 01/09/2010 )

As shown on chart 1, price of JCY is still falling, and breaking another historical new low, thus the downtrend remains intact and the 14, 21, 31 EMA is still serving as the dynamic resistance. Technical outlook for JCY is bearish.

As indicated by A, when price falls, volume increased significantly, this suggests that the selling pressure was high and seller rushed to sell off their share to new buyers whom are only willing to take up position at a lower price.

In short, heavy volume during a downtrend will further dampen the bearish sentiment on this counter, thus investors are urged not to try to catch the bottom, despite the falling of price, which appears to be cheap. Since price is breaking new low, no valid support is seen right now.

Leading PER

6.9 times

Dividend Yield

0%

Dividend

Earning Per Share

30/06/2009

0 sen

2.72 sen

31/03/2009

3.91 sen

3.22 sen

Table 1: JCY - 5161, Quarterly Dividend and Earning per Share.

Axiata – 6888: Uptrend continues, and new high.


Table 2: Axiata – 6888 (11/05/2010 ~ 01/09/2010)

Recently, the KLCI has been lifted by some heavy weighted index components, and one of them is Axiata. As shown on chart 2, price of Axiata remains above the 14, 21, 31 EMA, thus the uptrend remains intact.

In other words, for those who already bought this counter, it is a good idea to hold on to the position, until price should break below the 14, 21, 31 EMA, then it is a signal to take profit or the cut loss. As for those who are interested in taking up position, the idea entry point would be a formation of a higher-low; then, he or she must apply the 14, 21, 31 EMA as the trailing stop reference.

Nevertheless, as Axiata is breaking new high, next resistance for Axiata is at RM4.70 followed by RM5.00 level, while the 14, 21, 31 EMA is still serving as the dynamic support.

4 Q Rolling PER

14.68 times

Dividend Yield

0.00%

Dividend

Dividend Yield

Net Profit Ratio

31/12/2009

0 sen

0 %

12.61%

31/12/2008

0 sen

0 %

4.39 %

Table 2: Axiata – 6888, yearly dividend, dividend yield, and net profit ratio.

KNM – 7164: New low.


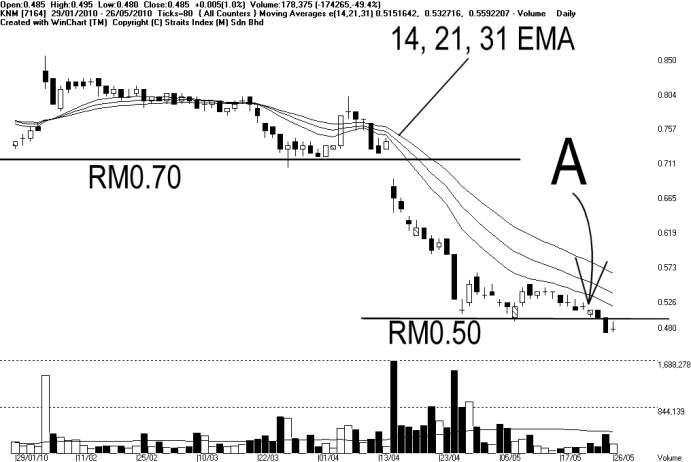
Table 3: KNM – 7164 (11/05/2010 - 01/09/2010)

As shown on chart 3, KNM has been moving sideways above the RM0.48~RM0.50 level for about 3 months, and this has built up a considerable memory for traders ( either those who are holding or who are watching on the sidelines). As indicated by A, price breaks below the RM0.48~RM0.50 support, making a new low. This means that all these investors who had bought at around RM0.48~RM0.50 in the past 3 months are all turning their profit (if any) into losses, thus creating a big negative impact.

It is devastating to think that this massive fall of share price is a big discount, and when one should start buying while price started to fall, he is trading against the trend. This is because all these traders who had bought this share earlier are mostly wanted to break even, hence the selling pressure is strong.

Technically, provided that price is still staying below the 14, 21, 31 EMA, the technical outlook for KNM is on the negative side, and despite the falling of share price, there is no reliable support level for now.

4 Q Rolling PER

31.43 times

Dividend Yield

0 %

Dividend

Dividend Yield

Net Profit Ratio

31/12/2009

0 sen

0 %

9.37%

31/12/2008

1.5 sen

3.7 %

13.30%

31/12/2007

4.0 sen

0.52 %

16.29%

31/12/2006

5.0 sen

0.57 %

14.56%

31/12/2005

5.0 sen

1.40 %

11.97%

Table 3: KNM – 7164, yearly dividend, dividend yield, and net profit ratio.

Conclusion:
Technical analysis is not just only a statistic of price movement, it also reflects traders' memory as well as psychology. One does not only study himself when he decides to take up a new position, he has to study what the losers or the winners are taking, and what losers and winners wants. Therefore, this explains why we need to trade with a trend, and avoid trading against it.


Copyright © 2009 Straits Index (M) Sdn BhdImportant Disclaimer:These content provided by Straits Index (M) Sdn Bhd is solely for education and information purposes only, and do not suggest any investment advices. All information displayed are believed to be accurate and reliable. Interpretation of the data or analysis is at the reader's own risk. Straits Index (M) Sdn Bhd reserves the rights but obligations to update, admen, or even terminate the materials. 重要声明:以上的内容由海峡指数(马)私人有限公司提供,纯粹是教育性质, 并不是任何的投资忠告。所有资料显示认为是准确和可靠的。对数据或分析的解释和用途是在于用户自己的风险。海峡指数(马)有限公司持有保留及义务更新,甚 至终止材料的权利。

Friday, August 20, 2010

Scomi, Mphb, KNM

Since falling from 1349.92 points, the KLCI has been falling for almost one month. However, many counters has been falling for over two months, losing more than 20% in value, and until now, still staying in downtrend. What are the technical conditions for a reversal? What is the characteristic of a reversal? Let's take a look at some counters and look out for some of these characteristics.

Scomi – 7158: Testing downtrend line.

Chart 1: Scomi – 7158 (05/02/201002/06/2010)

As shown on chart 1, price of Scomi formed a downtrend for two months, while during this downtrend, a few technical rebounds took place, but failed to break above the T1 downtrend line.

As indicated by A, now that price of Scomi is testing the T1 line again, it is a crucial timing. If price should break above the T1 line and then breaking above the 14, 21, 31 EMA, it would break away from this downtrend. But strong volume is needed to confirm such break out.

On the other hand, if volume should remain low, there is a risk of a false break out, as the buying interests is insufficient to off set the selling pressure. Nevertheless, support for Scomi at RM0.36~RM0.38 level.

4 Q Rolling PER

10.62

Dividend Yield

1.72%

Dividend

Dividend Yield

Net Profit Ratio

31/12/2009

11 sen

2.01%

15.92%

31/12/2008

3.25 sen

4.06%

5.58%

31/12/2007

1.90sen

0.63%

13.85%

31/12/2006

6.50sen

1.56%

10.49%

31/12/2005

6.50sen

1.46%

12.74%

Table 1: Scomi – 7158, yearly dividend, dividend yield, and net profit ratio.

MPHB – 3859: Downtrend, testing the downtrend line.

Chart 2: MPHB – 3859 (09/1/200902/06/2010)

As shown on chart 2, price of MPHB has formed a T1 downtrend for more than 2 months. During this downtrend, a few technical rebound took place, but failed to break above the T1 downtrend line, and formed lower-highs repeatedly, thus re-affirming the downtrend.

Now that price of MPHB is testing the T1 line and the 14, 21, 31 EMA again, it is a crucial point. If price should break above the T1 and the 14, 21, 31 EMA, with strong volume, it would break away from this downtrend, and stand a chance of a reversal. Then, the 14, 21, 31 EMA would be serving as dynamic support instead.

However, if price should break above the T1 and the 14, 21, 31 EMA with low volume, there is a bigger chance that price would prolong its sideways consolidation after breaking above the T1 line and the 14, 21, 31EMA, or a chance of a false breakout. If price should failed to break above the T1 line, and started falling again, it would form yet another lower-high, with weak technical outlook. Support for MPHB are at RM1.88~1.90 and the next support is at RM1.80.

4 Q Rolling PER

5.89 times

Dividend Yield

4.52%

Dividend

Dividend Yield

Net Profit Ratio

31/12/2009

9 sen

4.66 %

10.15 %

31/12/2008

10 sen

9.26 %

4.31 %

31/12/2007

11 sen

4.74 %

11.71 %

31/12/2006

0 sen

0%

36.54%

31/12/2005

0 sen

0%

-69.12%

Table 2: MPHB – 3859, yearly dividend, dividend yield, and net profit ratio.

Revision of last week's Case Study: KNM – 7164: Consolidating with weak biased.

Chart 3: KNM – 7164 (05/02/201002/06/2010)

As shown on chart 3, price of KNM is moving sideways around the RM0.50 level, in narrow range. As a result, the Bollinger Bands contracts, suggesting not only a consolidation signal, but that KNM is also preparing for a new movement, and the direction of the new movement shall be revealed once the Bollinger Bands re-expands.

Technically, when the Bollinger Bands has contracted for a period of time, its re-expansion signal is usually clearer. If price should stay above the Bollinger Middle Band as the Bollinger Bands re-expand, it would be a positive signal, then if investors choose to buy, they shall apply the Bollinger Middle Band as a trailing stop reference. On the other hand, if price should stay below the Bollinger Middle Band, as the Bollinger Bands expands, it would be a bearish signal. Immediate support for KNM is at RM0.47. If price should break below this support, it would be making a 15 months new low.

4 Q Rolling PER

17.31 times

Dividend Yield

0%

Dividend

Dividend Yield

Net Profit Ratio

31/12/2009

0 sen

0%

9.37%

31/12/2008

1.5 sen

3.70%

13.30%

31/12/2007

4.0 sen

1.27%

9.37%

31/12/2006

5.0 sen

0.57%

14.56%

31/12/2005

5.0 sen

1.40%

11.97%

Table 3: KNM – 7164, yearly dividend, dividend yield, and net profit ratio.

Conclusion:
Generally, the most ideal reversal pattern consists of the following, a valid technical rebound which break above the downtrend line or the dynamic resistance, with strong volume, then a formation of a higher-low, with strong volume. Strong volume is needed for it represents more inflow of fresh capital to off set the selling pressure.


Copyright © 2009 Straits Index (M) Sdn BhdImportant Disclaimer:These content provided by Straits Index (M) Sdn Bhd is solely for education and information purposes only, and do not suggest any investment advices. All information displayed are believed to be accurate and reliable. Interpretation of the data or analysis is at the reader's own risk. Straits Index (M) Sdn Bhd reserves the rights but obligations to update, admen, or even terminate the materials. 重要声明:以上的内容由海峡指数(马)私人有限公司提供,纯粹是教育性质, 并不是任何的投资忠告。所有资料显示认为是准确和可靠的。对数据或分析的解释和用途是在于用户自己的风险。海峡指数(马)有限公司持有保留及义务更新,甚 至终止材料的权利。

Supermx, KNM, AirAsia

As the US market rebounded last week, the KLCI rebound from the 1243 level, with many blue chips counters rebounded strongly. However, this is still a technical rebound, not yet a reversal. If the KLCI should remains above the 200-day MA, there is a good chance for the KLCI to prolong its consolidation, but as for regaining strength, more volume is needed, for if volume is still low, there are not enough inflow of fresh capital to off set the existing selling pressure.

Supermx – 7106: Forms Symmetrical Triangle

Chart 1:Supermx – 7106 (05/02/201002/06/2010)

As shown on chart 1, price of Supermx formed a Symmetrical Triangle, with L1 being a dynamic resistance, and L2 being a dynamic support. When price is forming a Symmetrical, its fluctuation is getting narrower, suggesting that Supermx is not only consolidating, but also preparing for a new movement, and the direction of the new movement shall be determined by the break out direction.

One of the advantages of a Symmetrical Triangle, is that it will usually give traders a 'timing' signal, and therefore, investors should be patience, while wait for the break out signal.

As indicated by A, price of Supermx is now testing the L2 dynamic support, and if price should break below this line, it would mark an end to the consolidation, suggesting a beginning of a downtrend formation. Other the other hand, if price should rebound from the L2 line and break above the L1 line, it would be a bullish break out, but it has to be confirmed by strong volume. Nevertheless, next resistance is at RM 7.03 and RM7.50, while the support is at RM5.75 and RM4.80.

4 Q Rolling PER

10.62 times

Dividend Yield

1.72%

Dividend

Dividend Yield

Net Profit Ratio

31/12/2009

11 sen

2.01%

15.92%

31/12/2008

3.25 sen

4.06%

5.58%

31/12/2007

1.90sen

0.63%

13.85%

31/12/2006

6.50sen

1.56%

10.49%

31/12/2005

6.50sen

1.46%

12.74%

Table 1: Supermx – 7106, yearly dividend, dividend yield, and net profit ratio.

KNM – 7164: Weak consolidation

Chart 2:KNM – 7164 (05/02/201002/06/2010)

As shown on chart 2, since breaking below the RM0.70 level, price of KNM has been trending down, and currently finding its support at around RM0.50 level. However, even though it is consolidating at RM0.50 level, the 14, 21, 31 EMA is still serving as a dynamic resistance, thus suggesting that the technical outlook for KNM is still weak.

As the US market rebounded, and many counters traded in Bursa Malaysia also rebounded. However, KNM did not follow the rebound but remains sideways. This implies that the buying interest of this counter is rather low.

If price should break below RM0.50, the RM0.50 would become a new resistance, in which it is a psychological level for investors wanting to break-even. Then, the 14, 21, 31 EMA shall continue serving as the dynamic resistance, and technical outlook is expected to be weak.

4 Q Rolling PER

16.78 times

Dividend Yield

0%

Dividend

Dividend Yield

Net Profit Ratio

31/12/2009

0 sen

0%

9.37%

31/12/2008

1.5 sen

3.70%

13.30%

31/12/2007

4.0 sen

1.27%

9.37%

31/12/2006

5.0 sen

0.57%

14.56%

31/12/2005

5.0 sen

1.40%

11.97%

Table 2: KNM – 7164, yearly dividend, dividend yield, net profit ratio.

Revision of Last Week's Casa Study: Airasia – 5099: Strong technical but has not downtrend remains.

Chart 3: Airasia – 5099 (09/1/200902/06/2010)

As shown on chart 3, price of AirAsia rebounded from RM1.10 level, and the rebound was rather strong. However, after the technical rebound, price of AirAsia precisely tested the 14, 21, 31 EMA, suggesting that it has not broken away from its downtrend, as indicated by A.

If price should remain resisted by the 14, 21, 31 EMA, there is a risk of a resume of downtrend, and the next target would be at RM1.10 support. Therefore, it is a sign to cut-loss. On the other hand, if price could break above the 14, 21, 31 EMA, with strong volume, then only price could break away from this downtrend. Nevertheless, support is at RM1.10 while the resistance is at RM1.30

4 Q Rolling PER

5.34 times

Dividend Yield

0%

Dividend

Dividend Yield

Net Profit Ratio

31/12/2009

0sen

0%

17.27%

31/12/2008

0sen

0%

-17.87%

31/12/2007

0sen

0%

38.90%

31/12/2006

0sen

0%

31.07%

31/12/2005

0sen

0%

10.25%

Table 3: Airasia – 5099, yearly dividend, dividend yield, and net profit ratio.

Conclusion:
Despite the technical rebound, the downtrend of the KLCI remains intact, and it is too early to see a reversal at the moment. It is generally a good practice to wait for the signal and not to trade too early. Of course, while waiting for the signal, investors should have their tradings plans ready.


Copyright © 2009 Straits Index (M) Sdn BhdImportant Disclaimer:These content provided by Straits Index (M) Sdn Bhd is solely for education and information purposes only, and do not suggest any investment advices. All information displayed are believed to be accurate and reliable. Interpretation of the data or analysis is at the reader's own risk. Straits Index (M) Sdn Bhd reserves the rights but obligations to update, admen, or even terminate the materials. 重要声明:以上的内容由海峡指数(马)私人有限公司提供,纯粹是教育性质, 并不是任何的投资忠告。所有资料显示认为是准确和可靠的。对数据或分析的解释和用途是在于用户自己的风险。海峡指数(马)有限公司持有保留及义务更新,甚 至终止材料的权利。

Thursday, August 19, 2010

Maxis, KNM, Lionind

Many individual counters had formed a downtrend, as global markets are falling heavily. Some investors believed that this might be a good idea to start buying while stocks are having a 'discount'. This is rather natural, for no body would like to buy things 'expensive' in nature. However, buying on dip during an uptrend correction, is still acceptable, for the existing trend is moving higher. In contrast, if buying on dip during a downtrend, is very risky, because no matter how long you are buying, you are still buying into an existing downtrend, where the fear is stronger than greed.

There is an important mindset about buying low, or buying at new low, which one should never over-look. Think carefully, if you are buying, thinking that this is a cheap price, then why would the seller on the other side is selling cheap to you? What makes you think that you are right and he is wrong? Don't forget, when price is trending down, more people will be losing money when they are holding their shares, and therefore, the needs to 'break-even' is very strong, thus selling pressure is always stronger. Therefore, it is not easy for price to go up. Let's take a look at some new low counters.

Maxis – 6012: Marks historical new low.

Chart 1: Maxis – 6012 (11/19/2009 ~ 26/05/2010 )

As indicated by A, price of Maxis fell below the RM5.20 level, marking a historical new low since its IPO. Despite a rebound form RM 5.10, the trend is still weak for Maxis, as when the price breaks below RM 5.20, all investors who had bought this share after the IPO is losing money, thus the selling pressure or the will to break even is strong.

If price should rebound and return to above RM 5.20, it will reduce the selling pressure and there is a good chance that price would consolidate around RM 5.20 level. However, if after the rebound, price should remained resisted by the 14, 21, 31 EMA, the technical outlook shall remain weak.

4 Q Rolling PER

18.75 times

Dividend Yield

2.93%

Dividend

Dividend Yield

Net Profit Ratio

31/12/2009

15

2.72%

20.73%

Table 1: Maxis – 6012, yearly dividend, dividend yield, and net profit ratio.

KNM – 7164: Testing important support.

Chart 2: KNM – 7164 (29/01/2010~26/05/2010)

As shown on the chart above, since breaking below RM 0.70 support on the 15th of april, price of KNM has been falling heavily, losing over RM 0.20 or 28%, until a rebound rebound at RM 0.50 level, which is the 76.4% Fibonacci Retracement line, then price consolidated at this level for around 1 month.

As indicated by A, during the consolidation at RM0.50, price is still trending weak, and if price should break below RM 0.50, it would be making a 14 months new low, thus more bearish outlook is expected. Technically, when price should break below RM 0.50, it would be a signal to cut loss, for more people will be losing money, and the selling pressure will get stronger. As long as price of KNM is still below the 14, 21, 31 EMA, the technical outlook shall remains weak.

4 Q Rolling PER

16.78 times

Dividend Yield

0%

Dividend

Dividend Yield

Net Profit Ratio

31/12/2009

0 sen

0%

9.37%

31/12/2008

1.5 sen

3.70%

13.30%

31/12/2007

4.0 sen

1.27%

9.37%

31/12/2006

5.0 sen

0.57%

14.56%

31/12/2005

5.0 sen

1.40%

11.97%

Table 2: KNM – 7164, yearly dividend, dividend yield, and net profit ratio.

Review Last week's Case Study: Lionind – 4235: Mark 6 months new low.

Chart 3: Lionind – 4235 (09/12/2009~26/05/2010)

As shown on chart 3, price of Lionind remained below the T1 downtrend line, this shows that Lionind is still trending down. As indicated by A, price of Lionind broke below RM 1.51 support, making a 6 months new low, and therefore, the RM 1.51 level is now the 'psychological' breaking even level for most investors who are still holding their shares, and this is becoming a resistance level, thus selling pressure is expected to be strong.

As at 26/5/2010, price of Lionind rebounded, but this is only a technical rebound, not a reversal yet. This is because price of Lionind is trending below the 14, 21, 31 EMA. It is rather risky to try to catch a rebound, as catching a rebound is actually buying into a downtrend, unless for short term speculating, which requires experience and time to monitor. Therefore, this short term catching rebound trading is not suitable for conservative investors.

4 Q Rolling PER

0 times

Dividend Yield

0.73%

Dividend

Dividend Yield

Net Profit Ratio

30/06/2009

1 sen

0.80%

-6.06%

30/06/2008

1 sen

0.38%

12.43%

30/06/2007

1 sen

0.57%

4.36%

30/06/2006

0.5 sen

0.52%

-0.29%

30/06/2005

1 sen

0.81%

8.26%

Table 3: Lionind – 4235, yearly dividend, dividend yield, and net profit ratio.

Conclusion:
In conclusion, other than picking the right stock and the right price, buying at the right direction is also an important factor for becoming a successful investor. If one should try to buy at the lowest price, he or she is most likely buying into a downtrend, and each day as price drop, there will be more regret buyers who now want to break even instead of making profit, thus the selling pressure is being accumulated. That is why, buying with the uptrend is more important than buying low. Provided one should apply a valid trailing stop as a trading plan, the risk of buying in an uptrend is much smaller than in a downtrend.


Copyright © 2009 Straits Index (M) Sdn BhdImportant Disclaimer:These content provided by Straits Index (M) Sdn Bhd is solely for education and information purposes only, and do not suggest any investment advices. All information displayed are believed to be accurate and reliable. Interpretation of the data or analysis is at the reader's own risk. Straits Index (M) Sdn Bhd reserves the rights but obligations to update, admen, or even terminate the materials. 重要声明:以上的内容由海峡指数(马)私人有限公司提供,纯粹是教育性质, 并不是任何的投资忠告。所有资料显示认为是准确和可靠的。对数据或分析的解释和用途是在于用户自己的风险。海峡指数(马)有限公司持有保留及义务更新,甚 至终止材料的权利。

Thursday, May 20, 2010

Case Studies CIMB, KNM, OSK


Chart 1: FBM KLCI (23/12/200921/04/2010)

As shown on Chart 1, the KLCI retreated after resisted by the 1347.61 level and started to consolidate, but it managed to stay above the 14, 21, 31 EMA, suggesting that the overall uptrend is still intact. However, as indicated by A, total market volume started to decline, suggesting that the market participation has reduced, as investors are staying on the sidelines while market direction is unclear. Technically, if volume should stay below the 40-day VMA level, it suggests that the market participation is insufficient, thus the market is less likely to pick up strength, or the consolidation is still intact.

Meanwhile, as shown on chart 2, the FBMACE is testing the 4130 support level, and if it should break below this level, more downside movement is expected. Generally, during a healthy bullish market, major indices should be rising together. But currently, the KLCI is moving in uptrend, but the FBMACE is moving in downtrend. Therefore, this suggests that the bullish market is very selective, thus not the most ideal condition. In other words, investors should pick stock with even more consideration.

Chart 2: FBMACE (23/12/200921/04/2010)

CIMB-1023]: Breaking below Ascending Wedge.


Chart 3: CIMB-1023 (23/12/200921/04/2010)

As shown on chart 3, price of CIMB formed an Ascending Wedge pattern, with the L1 line being the dynamic support and the L2 line being the dynamic resistance. An Ascending Wedge itself is an uptrend pattern, but with the upside volatility gradually reducing, implying that the uptrend is getting old.

As indicated by A, price of CIMB broke below the L1 line, suggesting that the L1 trend is over, but still supported by the 14, 21, 31 EMA. This shows that despite the L1 uptrend is no longer holding up, price of CIMB has not formed a downtrend yet.

Technically, if price should rebound as a pullback effect, and touch the L1 line, and later starts falling again, the L1 line would be the resistance line. And if price should break below the 14, 21, 31 EMA, there is a risk of a downtrend formation, thus a signal to cut loss.

4 Q Rolling PER

17.91 times

Dividend Yield

1.30%

Dividend

Dividend Yield

Net Profit Ratio

31/12/2009

18.50 sen

1.46%

26.31%

31/12/2009

25.00 sen

4.27%

25.22%

31/12/2009

25.00 sen

2.27%

31.00%

31/12/2009

15.00 sen

1.94%

23.53%

31/12/2009

15.00 sen

2.63%

17.51%

Table 1: CIMB-1023 yearly dividend, dividend yield, and net profit ratio.

KNM-714: Breaking new low.

Chart 4: KNM-714 (23/12/200921/04/2010)

As indicated by A, price of KNM broke below the RM0.70 support with a break-away gap. Technically, this is an important signal, because for those who had bought above the RM0.70 level, and all of them are now losing money. Therefore, the RM0.70 level will be a strong resistance level, for it would be a level for these losers to break even.

After breaking below RM0.70, price of KNM stopped falling when touching RM0.60 level, thus the RM0.60 level is the temporary support for KNM. Meanwhile, the RM0.60 is also the 61.8% of the Fibonacci Retracement line, calculated based on the lowest RM 0.32 to the highest RM1.09 level.

Based on the theory of Fibonacci, 61.8% retracement line is likely to be a reliable support level. However, as for breaking away from the downtrend, price would still need to break above the 14, 21, 31 EMA dynamic resistance, and if price should remain below the 14, 21, 31 EMA, the immediate technical outlook is still bearish biased. If price should break below RM0.60 level, it would be another signal to cut loss for the next support is seen at RM 0.50.

4 Q Rolling PER

14.32 times

Dividend Yield

0%

Dividend

Dividend Yield

Net Profit Ratio

31/12/2009

0 sen

0%

9.37%

31/12/2008

1.5 sen

3.7%

13.30%

31/12/2007

4.0 sen

0%

9.37%

31/12/2006

5.0 sen

0.57%

14.56%

31/12/2005

5.0 sen

1.40%

11.97%

Table 2: KNM-7164, yearly dividend, dividend yield, and net profit ratio.

Revision of previous Case Studies:OSK-5053: Uptrend is still intact.


Chart 5: OSK-5053 (23/12/200921/04/2010)

As shown on chart 5, price of OSK tested the RM1.47 resistance, and the immediate resistance is at RM1.47 level. Despite the resistance at RM1.47, the 14, 21, 31 EMA is still the dynamic support for OSK, suggesting that OSK is still trending up.

Technically, if price should break above the RM1.47, more upside room is expected, thus the uptrend shall continue. Other wise, if price should break below the 14, 21, 31 EMA, it would mark an end to the uptrend.

As for those who are already in position, it is a good idea to hold as long as the 14, 21, 31 EMA is still supporting the uptrend, it would be a much better signal if price could break above RM1.47. If price should break below 14, 21, 31 EMA, it would be a signal to take profit.

As for investors who are looking for buying signal, they have to wait until the bullish break out with strong volume, and then apply the 14, 21, 31 EMA as a trailing stop.

4 Q Rolling PER

8.31 times

Dividend Yield

5.21%

Dividend

Dividend Yield

Net Profit Ratio

31/12/2009

7.5 sen

6.1%

13.73%

31/12/2008

7.5 sen

7.58%

16.59%

31/12/2007

20 sen

8.62%

21.38%

31/12/2006

12.5 sen

6.38%

23.84%

31/12/2005

7.5 sen

7.85%

13.52%

Table 3: OSK-5053, yearly dividend, dividend yield, and net profit ratio.

Conclusion:

As the market is consolidating, many counters are having similar corrections. Therefore, selecting counters during a consolidation stage has to be very careful, and must select counters consolidating in an existing uptrend, and avoid downtrend stocks.


Copyright © 2009 Straits Index (M) Sdn BhdImportant Disclaimer:These content provided by Straits Index (M) Sdn Bhd is solely for education and information purposes only, and do not suggest any investment advices. All information displayed are believed to be accurate and reliable. Interpretation of the data or analysis is at the reader's own risk. Straits Index (M) Sdn Bhd reserves the rights but obligations to update, admen, or even terminate the materials. 重要声明:以上的内容由海峡指数(马)私人有限公司提供,纯粹是教育性质, 并不是任何的投资忠告。所有资料显示认为是准确和可靠的。对数据或分析的解释和用途是在于用户自己的风险。海峡指数(马)有限公司持有保留及义务更新,甚 至终止材料的权利。