Wednesday, March 24, 2010

LBS, Supermx, SAAG, Scomi.

Ever since the rebound from 1224 level, the KLCI short term movement has been improving, while breaking above the 14, 21, 31 EMA as well as the Bollinger Bands bullish signal. With the KLCI now above the Bollinger Middle Band, the immediate technically outlook is bullish biased, as indicated by A.


Chart 1: KLCI, from 27/10/2009 to 24/02/2010.

Despite technical indicating that the KLCI is gradually gaining strength, total market volume remains below the 40-day VMA level, suggesting that the overall market participation is still relatively low. This implies that the market confidence is also low.

Nevertheless, there are still some counters that are regaining their positions, while others are still trending down. Investors should pick stock carefully, and only select those counters which has a trend similar to the broad market, and avoid stocks that are still trending down.

Stocks going along with the broad market:

LBS

Chart 2: LBS, from 27/10/2009 to 24/02/2010.

As shown on chart 2, price of LBS went into a consolidation last month, but it was supported by the 14, 21, 31 EMA. As indicated by A, as the KLCI pick up some strength, price of LBS rebounded, and remained above the 14, 21, 31 EMA, thus suggesting that it might be resuming its uptrend, and the 14, 21, 31 EMA shall serve as the dynamic support.

If price should remains supported by the 14, 21, 31 EMA, the uptrend shall continue, and immediate resistance is at RM 0.85 level. If price should break above the RM0.85 resistance with strong volume, more upside movement is expected for LBS. If price should break below the 14, 21, 31 EMA, it would be a signal to take profit.

4 Q Rolling PER

13.07 times

Dividend Yield

0.63%

Dividend

Dividend Yield

Net Profit Ratio

31/12/2009

11 sen

2.01

15.92%

31/12/2008

3.25sen

4.06%

5.58%

31/12/2007

1.90 sen

0.63%

13.85%

31/12/2006

6.50sen

1.56%

10.49%

31/12/2005

6.50 sen

1.46%

12.74%

Table 1: LBS, yearly dividend, dividend yield, and net profit ratio.

Supermx

Chart 3: Supermx, from 27/10/2009 to 24/02/2010.

As shown on chart 3, price of Supermx resumed its uptrend, and breaking above the T1 mid term downtrend line as the KLCI pickup strength. As indicated by A, the 14, 21, 31 EMA is now serving as the dynamic support, thus the uptrend remains intact.

Immediate resistance for Supermx is at RM 6.18, and some profit taking activities is expected near this level. Nevertheless, it is a good idea to hold on to the stock as long as the 14, 21, 31 EMA is still supporting the uptrend. If price should break below the 14, 21, 31 EMA, it would be a signal to take profit.

4 Q Rolling PER

13.07 times

Dividend Yield

0.63%

Dividend

Dividend Yield

Net Profit Ratio

31/12/2009

11 sen

2.01

15.92%

31/12/2008

3.25sen

4.06%

5.58%

31/12/2007

1.90 sen

0.63%

13.85%

31/12/2006

6.50sen

1.56%

10.49%

31/12/2005

6.50 sen

1.46%

12.74%

Table 2: Supermx, yearly dividend, dividend yield, and net profit ratio.

Stocks going against the broad market:

SAAG

Chart 4: SAAG, from 27/10/2009 to 24/02/2010.

As indicated by A, price of SAAG is still trending down below the falling 14, 21, 31 EMA, and continuously making new low. This proves that the down trend is still intact, despite the strong rebound of the broad market, local and abroad.

Since SAAG is making new low, there is no reliable support sighted at the moment, but the 14, 21, 31 EMA shall remains at the dynamic resistance. In other words, provided that SAAG is still resisted by the falling 14, 21, 31 EMA, the bearish outlook is still intact.

4 Q Rolling PER

36.90 times

Dividend Yield

0%

Dividend

Dividend Yield

Net Profit Ratio

31/12/2008

0 sen

0%

5.63%

31/12/2007

5 sen

0.88%

5.87%

31/12/2006

3sen

1.86%

4.56%

31/12/2005

0 sen

0%

1.47%

31/12/2004

0 sen

0%

-1.35%

Table 3: SAAG, yearly dividend, dividend yield, and net profit ratio.

SCOMI

Chart 5: Scomi, chart from 27/10/2009 to 24/02/2010.

As shown on chart 5, despite the strong KLCI rebound, price of Scomir remains in the downtrend while resisted by the 14, 21, 31 EMA, which is serving as the dynamic resistance. Fortunately, as indicated by A, price of Scomi found at temporary support around RM 0.40, and now consolidating. If price should break above the 14, 21, 31 EMA, with strong volume, it would break away from the downtrend.

But until then, the current reading of Scomi is still weak. If price should break below the RM0.40 level, it would be making new low, thus resuming its downtrend movement after this consolidation. Therefore, it would be a signal to cut loss.

4 Q Rolling PER

4.39 times

Dividend Yield

1.22%

Dividend

Dividend Yield

Net Profit Ratio

31/12/2008

0.5 sen

1.49%

5.53%

31/12/2007

1.25 sen

1.10%

3.58%

31/12/2006

1.5sen

1.49%

5.37%

31/12/2005

1.20sen

1.20%

16.19%

31/12/2004

0.6 sen

0.36%

10.41%

Table 4: Scomi, yearly dividend, dividend yield, and net profit ratio.

Conclusion:
When the market turns bullish, investors have to always confirm the bullishness with volume. If volume should failed to break above the 40-day VMA level, it suggests that the rally was mostly on selective counters, thus picking the right stock would be harder. Therefore, investors should pick stocks that has the similar movement with the broad market, avoid stocks that are still trending down, despite blue chips or KLCI components.


Copyright © 2009 Straits Index (M) Sdn BhdImportant Disclaimer:These content provided by Straits Index (M) Sdn Bhd is solely for education and information purposes only, and do not suggest any investment advices. All information displayed are believed to be accurate and reliable. Interpretation of the data or analysis is at the reader's own risk. Straits Index (M) Sdn Bhd reserves the rights but obligations to update, admen, or even terminate the materials. 重要声明:以上的内容由海峡指数(马)私人有限公司提供,纯粹是教育性质, 并不是任何的投资忠告。所有资料显示认为是准确和可靠的。对数据或分析的解释和用途是在于用户自己的风险。海峡指数(马)有限公司持有保留及义务更新,甚 至终止材料的权利。

CIMB, Axiata, Genting, LCL, and Bursa.

The KLCI rebounded strongly, and breaking above the 14, 21, 31 Exponential Moving Average – EMA, as indicated by A. Meanwhile, the Bollinger Bands expanded, with the KLCI above the Bollinger Middle Band, thus giving a bullish signal. Technically, the KLCI is still lacking of one important bullish condition, which is the volume. (Please refer to arrow B).


Chart 1: KLCI chart from 27/10/2009 to 24/02/2010.

Based on the statistic in the past, if the KLCI should rally without volume reaching above the 40-day VMA level, it suggests that the rally is only selectively, and not a strong bullish market. Therefore, there are some counters gaining, while many counters are actually still trending down. Investors should carefully select the stocks that follow the broad market and avoid the stocks which are trending down.

Stocks that follow the market flow:

AXIATA

Chart 2: Axiata, from 27/10/2009 to 24/02/2010.

As indicated by A, price of Axiata followed the KLCI rebound, while continuously being supported by the 14, 21, 31 EMA, and tested the RM 3.50 resistance level. If price of Axiata should break above this resistance, it would be making a new high, thus suggesting a continuation of the uptrend. However, a valid break out has to be confirmed with strong volume, and provided that price of Axiata is still staying above the rising 14, 21, 31 EMA, it is a good idea to keep the stocks as the uptrend remains intact. If price should break below the 14, 21, 31 EMA, it would be a signal to take profit or to cut loss. If price should break above the RM 3.50 level, the next resistance for Axiata is seen at RM 4.10.

Leading PER

17.05 times

Dividend Yield

0%

Dividend

Dividend Yield

Net Profit Ratio

31/12/2008

0 sen

0%

4.39%

Table 1: Axiata, yearly dividend, dividend yield, and net profit ratio.

CIMB

Chart 3: CIMB, from 27/10/2009 to 24/02/2010.

As indicated by A, the CIMB gapped up and breaking above the 14, 21, 31 EMA dynamic resistance, with strong volume, therefore, it is likely that CIMB could resume its uptrend movement. Technically, a strong volume is needed to confirm a valid break out, as the increased of volume suggests more inflow of fresh capital, new buying interest to off-set the selling pressure. If volume is low during a break out, the break out would not be confirmed.

If price of CIMB should remain supported by the 14, 21, 31 EMA, the uptrend is still intact, and it is a good idea to hold the stock, until the price should break below 14, 21, 31 EMA, it would be a signal to take profit. Next resistance for CIMB isat RM 13.58.

4 Q Rolling PER

15.92 times

Dividend Yield

1.46%

Dividend

Dividend Yield

Net Profit Ratio

31/12/2009

18.5 sen

1.46%

26.31%

31/12/2008

25 sen

4.27%

25.22%

31/12/2007

25 sen

2.27%

31.00%

31/12/2006

15 sen

1.94%

23.53%

31/12/2005

15 sen

2.63%

17.51%

Table 2: CIMB, yearly dividend, dividend yield, and net profit ratio.

Stocks going against the broad market:

LCL

Chart 4: LCL, from 27/10/2009 to 24/02/2010.

As shown on Chart 4, the Bollinger Bands of LCL contracted, suggesting that LCL is consolidating while preparing for a new movement. As indicated by A, the Bollinger Bands re-expanded with the price below the Bollinger Bands, thus giving a bearish signal. If the Bollinger Bands should continue to expand with price staying below the Bollinger Middle Band, more downside movement is expected. Support for LCL is at RM0.12 while the Bollinger Middle Band is serving as the dynamic resistance.

4 Q Rolling PER

-0.08 times

Dividend Yield

0%

Dividend

Dividend Yield

Net Profit Ratio

31/12/2009

0 sen

0%

-126.96%

31/12/2008

0 sen

0%

2.01%

31/12/2007

10 sen

1.56%

7.41%

31/12/2006

10 sen

6.06%

7.62%

31/12/2005

0 sen

0%

7.00%

Table 3: LCL yearly dividend, dividend yield, and net profit ratio.

GENTING

Chart 5: Genting, from 27/10/2009 to 24/02/2010.

As shown on chart 5, price of Genting continued its downtrend movement, after breaking below the RM 6.60 support. As indicated by A, the 14, 21, 31 EMA is still falling while serving as the dynamic resistance, and technically, as long as price is still staying below the 14, 21, 31 EMA, the downtrend shall remains intact.

Despite being a component of the KLCI, price of Genting failed to rebound together with the KLCI. This proves that the importance of identifying a stock that moves along with the direction of the broad market, investors can not just pick any KLCI component counters.

4 Q Rolling PER

34.44 time

Dividend Yield

1.11%

Dividend

Dividend Yield

Net Profit Ratio

31/12/2008

7 sen

1.89%

6.27%

31/12/2007

37sen

0.98%

12.15%

31/12/2006

32sen

0.97%

21.66%

31/12/2005

29sen

1.36%

22.86%

31/12/2004

24sen

1.26%

19.97%

Table 4: Genting, yearly dividend, dividend yield, and net profit ratio.

BURSA

Chart 6: Bursa, from 27/10/2009 to 24/02/2010.

As shown on chart 6, price of Bursa did not rebound, despite the strong rebound of the KLCI, and it is still staying below the falling 14, 21, 31 EMA, thus showing that the downtrend is still intact. Currently, as indicated by A, support for Bursa is at RM 7.17 level, and if price should break below this level, it would be making a new low, and more downside risk is expected as the downtrend remains intact.

4季滚动本益比
4 Q Rolling PER

21.66

周息率 (Dividend Yield

2.62%

股息 (Dividend

周息率 (Dividend Yield

净利润率(Net Profit Ratio

20091231

19.10

2.46%

44.13%

2008 1231

24.30

4.72%

31.48%

2007 1231

85.00

5.94%

48.91%

2006 1231

54.50

6.77%

41.55%

20051231

20.00

5.46%

42.13%

Table 5: Bursa yearly dividend, dividend yield, and net profit ratio.

Conclusion:
It is important to note that to follow the broad market flow, one should pick stocks that have the similar movement, and simply picking any KLCI component or any blue chips is not the way.


Copyright © 2009 Straits Index (M) Sdn BhdImportant Disclaimer:These content provided by Straits Index (M) Sdn Bhd is solely for education and information purposes only, and do not suggest any investment advices. All information displayed are believed to be accurate and reliable. Interpretation of the data or analysis is at the reader's own risk. Straits Index (M) Sdn Bhd reserves the rights but obligations to update, admen, or even terminate the materials. 重要声明:以上的内容由海峡指数(马)私人有限公司提供,纯粹是教育性质, 并不是任何的投资忠告。所有资料显示认为是准确和可靠的。对数据或分析的解释和用途是在于用户自己的风险。海峡指数(马)有限公司持有保留及义务更新,甚 至终止材料的权利。

Case Studies: Latexx, Genting, Sime.


Chart 1: KLCI chart from 20/10/2009 to 17/02/2010.

Based on the above chart, the KLCI rebounded 23.85 points or 1.9% from 1224 points, but could the KLCI resume its uptrend? Technically, due to the lack of volume, which suggests the insufficient inflow of fresh capital, the KLCI is lack of one of the important bullish conditions. Meanwhile, the KLCI is still testing the 14, 21, 31 EMA, which is still serving as the dynamic resistance. To conclude, the KLCI had only a technical rebound last week.

Latexx:

Chart 2: Latexx, chart from 20/10/2009 to 17/02/2010.

As shown on chart 2, price of Latexx fell last month, as lead by the broad market. But it managed to consolidate at the 14, 21, 31 EMA, which is serving as the dynamic support. Therefore, it means that the uptrend has not be violated. As the KLCI rebounded last week, price of Latexx regained its position above the 14, 21, 31 EAM.

Technically, if price should remain above the 14,21, 31 EMA, there is a good chance for it to resume its uptrend, and the best confirmation would an increased of volume. For those who are holding, and feeling uncomfortable, a partial profit taking is a good alternative.

Nevertheless, next resistance for Latexx is at RM 4.23 while the support is at RM 3.42 other than the 14, 21, 31 EMA.

4 Q Rolling PER

14.60 times

Dividend Yield

0.51%

Dividend

Dividend Yield

Net Profit Ratio

31/12/2009

2 sen

0.53%

15.86%

31/12/2008

0 sen

0.00%

6.97%

31/12/2007

0 sen

0.00%

3.40%

31/12/2006

0 sen

0.00%

2.79%

31/12/2005

0 sen

0.00%

3.35%

Table 1: Latexx, yearly dividend, dividend yield, and Net profit ratio.

Genting

Chart 3: Genting, chart from 20/10/2009 to 17/02/2010.

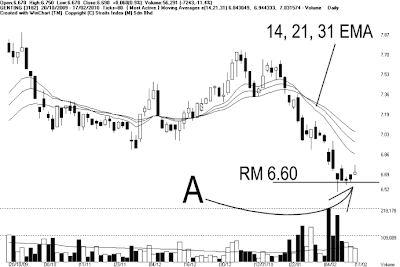
Price of Genting formed a downtrend as pulled by the KLCI, and the 14, 21, 31 EMA is serving as the dynamic resistance. As indicated by A, despite the KLCI rebounded strongly, price of Genting remains below the 14, 21, 31 EMA. Volume also did not increased when price of Genting rebound, this suggests that the buying interests is still weak. In other words, the downtrend for Genting remains intact. Nonetheless, support for Genting is at RM 6.60 level, while the 14, 21, 31 EMA is still the dynamic resistance.

If price should continue to stay below the falling 14, 21, 31 EMA, and break below the RM6.60 level, it means that the consolidation has ended, and price of Genting is resuming its downtrend, and the next support is at RM 6.00. In other words, if price should break RM 6.60, it is a signal to cut loss.

4 Q Rolling PER

36.46 times

Dividend Yield

1.05%

Dividend

Dividend Yield

Net Profit Ratio

31/12/2008

7 sen

1.89%

6.27%

31/12/2007

37 sen

0.98%

12.15%

31/12/2006

32 sen

0.97%

21.66%

31/12/2005

29 sen

1.36%

22.86%

31/12/2004

24 sen

1.26%

19.97%

Table 2: Genting, yearly dividend, dividend yield, and net profit ratio.

Sime

Chart 4: Sime, chart from 20/10/2009 to 17/02/2010.

As shown on Chart 4, price of Sime has been falling for about a month, while the 14, 21, 31 EMA is serving as the dynamic resistance. As indicated by A, price of Sime technically rebounded, in line with the KLCI rebound, and the immediate support is at RM 8.28 level. However, price of Sime is precisely resisted by the 14, 21, 31 EMA, this suggests that Sime is still in a downtrend, and the rebound was merely technical.

If price should break above the 14, 21, 31 EMA, there is a chance that Sime would break away from the downtrend, but this has to be confirmed with substantial increased of volume. On the other hand, if price should remain resisted by the falling 14, 21, 31 EMA, the downtrend shall continue.

In other words, when price begins to fall after being resisted by the 14, 21, 31 EMA, it is a signal to take profit, because if price should break below RM8.28, it would be making a new low.

4 Q Rolling PER

24.30 times

Dividend Yield

2.39%

Dividend

Dividend Yield

Net Profit Ratio

30/06/2009

20.30 sen

2.92%

7.35%

30/06/2008

49 sen

5.30%

10.32%

30/06/2007

30.20 sen

3.15%

7.26%

30/06/2006

30 sen

5.45%

5.56%

30/06/2005

26 sen

4.48%

4.30%

Table 3: Sime, yearly dividend, dividend yield, and net profit ratio.

Conclusion:
For the investors who are having losses, technical rebound is a chance to reduce losses. As for short term speculator, a technical rebound is a chance for some short term trading, provided with skills, of course. However, a short term trader should always be clear of his original intention, which is to speculate, and once price move against him, he should cut loss without any doubts.


Copyright © 2009 Straits Index (M) Sdn BhdImportant Disclaimer:These content provided by Straits Index (M) Sdn Bhd is solely for education and information purposes only, and do not suggest any investment advices. All information displayed are believed to be accurate and reliable. Interpretation of the data or analysis is at the reader's own risk. Straits Index (M) Sdn Bhd reserves the rights but obligations to update, admen, or even terminate the materials. 重要声明:以上的内容由海峡指数(马)私人有限公司提供,纯粹是教育性质, 并不是任何的投资忠告。所有资料显示认为是准确和可靠的。对数据或分析的解释和用途是在于用户自己的风险。海峡指数(马)有限公司持有保留及义务更新,甚 至终止材料的权利。

Case Studies - Axiata, CIMB, Supermx.


Chart 1: KLCI chart from 20/10/2009 to 17/02/2010.

Since the rebound at 1224.37 points, the KLCI gained 23.85 or 1.9%. During the rebound of the KLCI, many counters have also rebounded, while the performance varies. Some counters failed to break away from its downtrend despite the rebound; some broke above the dynamic resistance, while some resumed its uptrend. Here are some case studies for this week.

Axiata: Uptrend intact, testing new high


Chart 2: Axiata, chart from 20/10/2009 to 17/02/2010.

As shown on chart 2, despite the price of Axiata retreated, it was supported by the 14, 21, 31 EMA. As indicated by A, the 14, 21, 31 EMA is still serving as the dynamic support for Axiata, price price since rebounded from the 14, 21, 31 EMA, it is now testing its resistance at RM 3.50. This suggests that price of Axiata is still trending up but only resisted by RM 3.50 resistance.

Technically, provided that price of Axiata is supported by the rising 14, 21, 31 EMA, the uptrend shall remains intact. If price should break above RM 3.50 level, it would be making a new high, thus the uptrend is expected to carry on, and the next resistance is seen at RM 3.74. For trend trading investors, as long as price is still supported by the 14, 21, 31 EMA, it is a good idea to hold on to the position, until price should break below the 14, 21, 31 EMA. If investors should feel uncomfortable, a partial profit taking is also a good alternative, in which it partially reduces trading risk while retain a portion for the uptrend potential.

Leading PER

17.05 times

Dividend Yield

0%

Dividend

Dividend Yield

Net Profit Ratio

31/12/2008

0 sen

0%

4.39%

Table 1: Axiata, yealy Dividend, Dividend Yield, and Net Profit Ratio.

CIMB: Technical Rebound, downtrend remains.


Chart 3: CIMB, chart from 20/10/2009 to 17/02/2010.

As shown on chart 3, as the KLCI technically rebounded, price of CIMB also rebounded from RM12.06 level, and until now, it has gained RM0.495 or 4.3%. However, as indicated by A, it is precisely resisted by the 14, 21, 31 EMA, which is the dynamic resistance. This suggests that the recent rebound was merely a technical rebound, not a reversal yet.

If price should remains resisted by the 14, 21, 31 EMA, there is a risk of resuming its downtrend, while the first support is at RM 12.06 level, and the 14, 21, 31 EMA shall continue serving as the dynamic resistance.

Generally, a technical rebound is not the best time to buy, but a good chance to take profit or get out. If price should start falling again after being resisted by the 14, 21, 31 EMA, and breaks below RM12.06 level, it would be making a new low.

4 Q Rolling PER

18.90 times

Dividend Yield

2.01%

Dividend

Dividend Yield

Net Profit Ratio

31/12/2008

25 sen

4.27%

25.22%

31/12/2007

25 sen

2.27%

31.00%

31/12/2006

15 sen

1.94%

23.53%

31/12/2005

15 sen

2.63%

17.51%

31/12/2004

15 sen

3.19%

18.01%

Chart 2: CIMB, yearly dividend, dividend yield, and net profit ratio.

SupermxBreak away from a mid term downtrend.

Chart 4: Supermx, chart from 20/10/2009 to 17/02/2010.

As the KLCI took a dip after touching 1308, price of Supermx followed, and formed a T1 downtrend, and price of Supermx also broke below the 14, 21, 31 EMA. However, when the KLCI rebounded from the 1224 level, price of Supermx also rebounded, and also breaking above the 14, 21, 31 EMA as well as the T1 downtrend line. Technically, it breaks away from the mid term downtrend, and managed to stay above the 14, 21, 31 EMA again.

Technically, this is a good signal, suggesting that price of Supermx is now resuming its uptrend, and the best confirmation would be an increased of volume. If price should remain supported by the 14, 21, 31 EMA, the uptrend shall remain intact, and the next resistance is seen at RM 6.18 level. Trend trading investors should hold on to their positions as long as the 14, 21, 31 EMA is still supporting the uptrend. If price should break below the 14, 21, 31 EMA, it would be a signal to take profit, and the lower support line is at RM 4.80 level.

4 Q Rolling PER

13.07 times

Dividend Yield

0.63%

Dividend

Dividend Yield

Net Profit Ratio

31/12/2008

3.25 sen

4.06%

5.58%

31/12/2007

1.90 sen

0.63%

13.85%

31/12/2006

6.50 sen

1.56%

10.49%

31/12/2005

6.50 sen

1.46%

12.74%

31/12/2004

5.00 sen

1.06%

13.83%

Table 3: Supermx, Yearly dividend, dividend yield, and net profit ratio.

Conclusion:
Technical rebound and reversal is different. Investors should learn to differentiate the above two, and make the best decision with given conditions.


Copyright © 2009 Straits Index (M) Sdn BhdImportant Disclaimer:These content provided by Straits Index (M) Sdn Bhd is solely for education and information purposes only, and do not suggest any investment advices. All information displayed are believed to be accurate and reliable. Interpretation of the data or analysis is at the reader's own risk. Straits Index (M) Sdn Bhd reserves the rights but obligations to update, admen, or even terminate the materials. 重要声明:以上的内容由海峡指数(马)私人有限公司提供,纯粹是教育性质, 并不是任何的投资忠告。所有资料显示认为是准确和可靠的。对数据或分析的解释和用途是在于用户自己的风险。海峡指数(马)有限公司持有保留及义务更新,甚 至终止材料的权利。

Delaying Cutting Loss is High Risk.

To make profit from the stock market, is not only knowing how to spot for buy signal, but more importantly, knowing when to cut-loss. When the broad market is correcting, many individual counters are likely to have their correction as well. Smart investors know how trading with the broad market, and definitely know when to get out, because there will be buy signal again.


Chart 1: FBM KLCI, chart from 8/10/2009 to 3/2/2010.

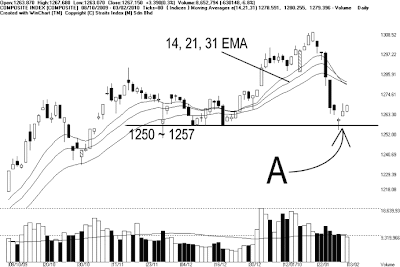
As shown on chart 1, the FBM KLCI started its high volatile technical correction after breaking above the 1300 mark briefly, and as a result, the KLCI fell below the 14, 21, 31 EMA, which is now serving as the dynamic resistance. However, as indicated by A, the KLCI is still supported by the 1250~127 level, and temporary consolidating from its downward movement. But despite its consolidation, the KLCI is still resisted by the falling dynamic resistance, thus the immediate outlook is bearish biased.

If the KLCI should rebound from the 1250 and break above the 14, 21, 31 EMA, together with the increased of market volume above the 40-day VMA level, the KLCI should have a chance to regain some strength. Other wise, if the KLCI should break below 1250, more downside movement is expected.

When the broad market is weakening, individual counters tend to be weak as well, and therefore, investors should follow the broad market direction, and never trade against it. A smart investor should have his/ her trading plan well laid out before buying any share, and when price should trigger the cut-loss level, it is only logic to act upon it, to avoid unnecessary risk.


Chart 2: Airasia, chart from 7/1/2008 to 24/06/2008.

As indicated by A, the Bollinger Bands Width re-expanded, with price of Airasia below the Bollinger Middle Band, thus signaling bullish biased signal, and investors can choose to buy with this signal, with the first cut-loss point at the Bollinger Middle Band. As indicated by B, price of Airasia fell below the Bollinger Middle Band, thus triggered the cut loss point, and investors should honor their trading plan and cut loss (RM 1.56).

As pointed by C, D, and D, the Bollinger Bands contracted and re-expanded but every time it expands, price is below the Bollinger Middle Band, thus suggesting the downtrend is still intact. If investors should failed to cut loss at arrow B, he or she would suffer a great loss by holding on their shares in the downtrend.

Cutting Loss Promptly:

No body could forecast the future movement of the market, regardless of what methods they use. One could only apply studies and analysis with statistic. One should understand the reality that investing has not perfect formula nor short-cut methods, nor any automatic stock picking softwares. Investment is personal professional business, which requires skills and experience, and lots of hard work. Therefore, investing is more than picking the right stock, it is all about trading plan.

Any reasons can cause the stock price to fall, but the only reason why investors lose money is because they never cut-loss. The highest risk in trading is not the high or low of the stock price, but not cutting loss.

Loss

% to Break-even

10%

11.11%

20%

25%

30%

42.86%

50%

100%

Table 1: % to recover after a loss in order to breakeven.

As shown by Table 1, if an investor cut loss after losing 10%, he will get 90% of his remaining cash, and he could start over again when the same stock or another stock gives him the right signal to buy. If at the next trade, the stock forms an uptrend, all he needs is a gain of 11.11% to regain all his previous losses. Therefore, recovering a 10% loss is not difficult, and provided the investor has cash, there will be opportunities.

However, if one should failed to cut loss and if the loss is 50%, it will be too late. Because, if a stock price should fall 50%, it need to regain 100% just to get back to the original level. In other words, if one cut loss after losing 50%, he will only have 50% in cash, and he need to buy a stock that could rise 100% in order for him to break even. Compare 100% and 11.11%, and you shall see the reality and probabilities of winning. Reducing trading risk, is actually also increasing chances of winning.

Last week's Case Studies Review:

AMMB

Chart 3: AMMB, chart from 11/09/2009 to 3/2/2010.

As indicated by A, after breaking below the 14, 21, 31 EMA, price of AMMB rebounded from its RM4.70 support, and temporary stopped the decline and consolidated. However, as indicated by B, the 14, 21, 31 EMA is still falling while serving as its dynamic resistance, therefore, the technical outlook for AMMB is now bearish biased. Technically, all rebound below the 14, 21, 31 EMA are only technical rebound, not a sign of a reversal yet.

In other words, if price should rebound and break above the 14, 21, 31 EMA, then there is a chance for AMMB to regain is position, and re-test the RM5.36 resistance. Otherwise, if price should stay below the falling 14, 21, 31 EMA, and break below the RM 4.70 support, it would be a signal to cut loss, because the next support for AMMB is seen at RM 4.40 level.

4 Q Rolling PER

14.62 times

Dividend Yield

1.63%

Dividend

Dividend Yield

Net Profit Ratio

31/3/2009

8 sen

3.07%

14.69%

31/3/2008

6 sen

1.74%

11.13%

31/3/2007

5 sen

1.33%

-.3.38%

31/3/2006

5 sen

1.77%

7.34%

31/3/2005

4 sen

1.42%

4.35%

Table 2: AMMB, Yearly Dividend, Dividend Yield, and Net Profit Ratio.

CIMB

Chart 4: CIMB, chart from 14/09/2009 to 3/2/02010.

As shown on chart 4, after breaking below the 14, 21, 31 EMA, price of CIMB has been trending lower. As indicate by A, price of CIMB is testing the RM 12.80 support level while consolidating. This suggests that the support of RM 12.80 is still effective. However, as indicated by B, the 14, 21, 31 EMA is still serving as the dynamic resistance. Technically, this suggests that the outlook for CIMB is still on the negative side.

If price should break above the 14, 21, 31 EMA, it would have a chance to break away from this bearish biased movement. If price should failed to rebound from the RM 12.80 support, it would be a good idea to reduce position, for the next support is seen at RM 11.68.

4 Q Rolling PER

19.39 times

Dividend Yield

1.96%

Dividend

Dividend Yield

Net Profit Ratio

31/12/2008

25 sen

4.27%

25.22%

31/12/2007

25sen

2.27%

31.00%

31/12/2006

15sen

1.94%

23.53%

31/12/2005

15sen

2.63%

17.51%

31/12/2004

15sen

3.19%

18.01%

Table 3: CIMB yearly Dividend, Dividend Yield, and Net Profit Ratio.

Conclusion:
The biggest killer in the market is not the falling of the stock price, but refusing to cut-loss. In fact, it is very important to trading with the direction of the broad market, and provided that investors could follow their own trading plan, the risk of trading is actually limited.


Copyright © 2009 Straits Index (M) Sdn BhdImportant Disclaimer:These content provided by Straits Index (M) Sdn Bhd is solely for education and information purposes only, and do not suggest any investment advices. All information displayed are believed to be accurate and reliable. Interpretation of the data or analysis is at the reader's own risk. Straits Index (M) Sdn Bhd reserves the rights but obligations to update, admen, or even terminate the materials. 重要声明:以上的内容由海峡指数(马)私人有限公司提供,纯粹是教育性质, 并不是任何的投资忠告。所有资料显示认为是准确和可靠的。对数据或分析的解释和用途是在于用户自己的风险。海峡指数(马)有限公司持有保留及义务更新,甚 至终止材料的权利。

Plantation Counters.

Malaysian is one of the world's most important palm oil and rubber producer in the world, and plantations counters are generally covering a considerable position of fund manager's portfolios. This week, we shall take a look at some plantation counters.

IOI: Break below Rectangular.


Chart 1: IOI, chart from 25/08/2009 to 03/02/2010.

As shown on chart 1, price of IOI has been trading in the trading range betwee the RM 5.30 and RM 5.60 for nearly 4 months, forming a Rectangular pattern. This suggests that the direction for IOI is unclear, until a break out below the RM 5.30 level, as indicated by A.

After price breaking below the RM 5.30 level, the 14, 21, 31 EMA was also falling, thus serving as the dynamic resistance. Technically, it is a time to cut-loss when price broke below RM 5.30 level. If one should find it hard to cut loss immediately, gradually reducing position would be a wise move as well.

Despite the rebound at RM 5.00, price of IOI failed to break above the 14, 21, 31 EMA, and therefore, the downtrend remains intact. If price should continue falling, those who had reduced their position would find that cutting loss is no longer difficult, for they had accepted the idea of cutting losses. Support for IOI is at RM 5.00 while the resistance is at RM 5.30 followed by the 14, 21, 31 EMA.

4 Q Rolling PER

26.13 times

Dividend Yield

1.55%

Dividend

Dividend Yield

Net Profit Ratio

30/06/2009

8 sen

1.69%

6.74%

30/06/2008

17 sen

2.28%

15.22%

30/06/2007

7sen

1.35%

16.55%

30/06/2006

43.50 sen

3.04%

13.81%

30/06/2005

35.50 sen

3.33%

14.86%

Table 1: IOI yearly Dividend, Dividend Yield, and Net Profit Ratio.

GENP: Testing Support line.

Chart 2: GENP, chart from 1/09/2009 to 3/2/2010.

As shown by chart 2, after price of GENP has dropped below the 14, 21, 31 EMA on the 26thof January, 2010, it is now testing the RM 6.00 support level. As indicated by A, although price of GENP did not rebounded obviously, it has stopped falling. Therefore, this implies that the RM6.00 support effect remains intact. Technically, price has to stay above the RM 6.00 level, then only it could consolidate. For this case, investors could choose to partially reducing position.

Since price of GENP is still staying below the 14, 21, 31 EMA, the technical outlook shall remain bearish biased. If price should continue to be resisted by the falling 14, 21, 31 EMA, the bearish outlook shall remain intact. Next support for GENP is at RM5.50 level.

4 Q Rolling PER

23.60 times

Dividend Yield

1.65%

Dividend

Dividend Yield

Net Profit Ratio

31/12/2008

10 sen

2.82%

36.03%

31/12/2007

14 sen

1.62%

37.97%

31/12/2006

7sen

1.64%

29.68%

31/12/2005

6.25 sen

2.91%

32.87%

31/12/2004

5.50 sen

3.02%

33.92%

Table 2: GENP, yearly Dividend, Dividend Yield, and Net Profit Ratio.

KLK: Entering Consolidation.

Chart 3: KLK, chart from 20/10/2009 to 3/2/2010.

As shown on chart 3, price of KLK started falling as profit taking took place, after it touches its peak at RM 17.26, and since then, it movement is still weakening. As indicated by A, price of KLK remains below the Bollinger Middle Band, thus the immediate outlook is still on then negative side. However, the Bollinger Bands is contracting now, suggesting that KLK is likely to consolidate from now.

If price of KLK should break above the Bollinger Middle Band, and the Bollinger Bands should re-expand, there is a chance for KLK to break away from its weakening movement, but this signal has to be confirmed with a substantial increased of volume. However, if price should remain resisted by the Bollinger Middle Band, and once the Bollinger Bands re-expands, more downside movement for KLK is expected, and the next support for KLK is seen at RM 15.80 level, while the resistance is at RM 17.26 WinChart Automatic Fibonacci Retracement.

4 Q Rolling PER

28.86 time s

Dividend Yield

2.41%

Dividend

Dividend Yield

Net Profit Ratio

30/09/2009

40 sen

2.90%

9.20%

30/09/2008

70 sen

7.29%

13.25%

30/09/2007

50 sen

3.79%

13.70%

30/09/2006

50 sen

4.59%

11.06%

30/09/2005

40 sen

5.16%

10.84%

Table 3: KLK, yearly Dividend, Dividend Yield, and Net Profit Ratio.

SIME: Bearish Biased.


Chart 4: SIME, chart from 17/09/2009 to 3/2/2010.

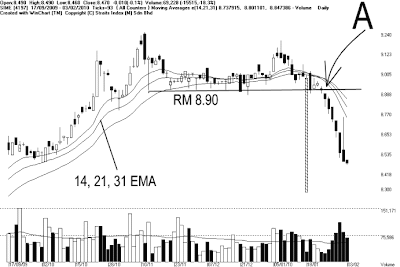
As indicated by A, after being supported by the RM 8.90 for about 2 months, price of SIME finally broke below the RM8.90 level, and the 14, 21, 31 EMA serves as the dynamic resistance. Since breaking below RM8.90 level, SIME has falled RM0.47 or 5.3%, and until now, it has not found a reliable support. Technically, provided that it is still resisted by the dynamic resistance, the outlook shall remain bearish biased. When price broke below a support level, it is a signal to cut-loss. Nonetheless, next support for SIME is seen at RM 8.23 WinChart Automatic Fibonacci Retracement while the resistance remains at the 14, 21, 31 EMA.

4 Q Rolling PER

24.30 times

Dividend Yield

2.39%

Dividend

Dividend Yield

Net Profit Ratio

30/06/2009

20.30 sen

2.92%

7.35%

30/06/2008

49 sen

5.30%

10.32%

30/06/2007

30.20 sen

3.15%

7.26%

30/06/2006

30 sen

5.45%

5.56%

30/06/2005

26 sen

4.48%

4.30%

Table 4: SIME, yearly Dividend, Dividend Yield, and Net Profit Ratio.

Conclusion:
With market sentiment turning weaker, plantation counters are also not performing well. It is important for investors to always trade with the direction of the broad market, and if the chart should show any uncertain signal, or investors should feel uncomfortable, it is always a good idea to partially reduce position, and still, a laying out a trading plan before buying is absolutely important.


Copyright © 2009 Straits Index (M) Sdn BhdImportant Disclaimer:These content provided by Straits Index (M) Sdn Bhd is solely for education and information purposes only, and do not suggest any investment advices. All information displayed are believed to be accurate and reliable. Interpretation of the data or analysis is at the reader's own risk. Straits Index (M) Sdn Bhd reserves the rights but obligations to update, admen, or even terminate the materials. 重要声明:以上的内容由海峡指数(马)私人有限公司提供,纯粹是教育性质, 并不是任何的投资忠告。所有资料显示认为是准确和可靠的。对数据或分析的解释和用途是在于用户自己的风险。海峡指数(马)有限公司持有保留及义务更新,甚 至终止材料的权利。