Showing posts with label Axiata. Show all posts

Thursday, May 19, 2011

KLCI, Axiata, Benalec, Tenaga


Chart 1: KLCI as at 20/4/2011.

As indicated by A, the FBM KLCI rebounded near the 1513 support on the 20th of April, and now testing the 14, 21, 31 EMA. If the KLCI could successfully break above the 14, 21, 31 EMA, it would likely to form a higher-low, which is a first characteristic of an uptrend formation. Next resistance for the KLCI is at the recent high of 1566 and the historical high of 1577.

Meanwhile, as indicated by B, total market volume remains low despite increasing slightly. Generally, with volume below the 40-day Volume Moving Average, it suggests that the market participation is low, and the inflow of fresh capital is also low. Therefore, the KLCI is less likely to pickup its strength.

This week's case studies:

Axiata – 6888: Testing important support of the year 2011.


Chart 2: Axiata – 6888 as at 20/04/2011.

As shown on chart 2, price of Axiata has been testing the RM 4.68~RM 4.70 a few times in 2011, and fortunately, until now, it is still supported by RM 4.68~RM .470. Therefore, the RM 4.68~RM 4.70 has become the important support for 2011.

As indicated by A, for the past two months, price of Axiata has been trending weak, and now testing the RM 4.68~RM 4.70 again. If price should break below this support, it means that those whom had been holding since December 2010, will turn their profit into losses. Therefore, it would create a strong negative memory at this level, and it could trigger more selling.

In other words, when price is testing an important support, it may seen like it is forming a bottom, but we should not try to buy low. As for long term investors, a good idea is to refer to the weekly chart of Axiata for a bigger picture. Refer to Chart 2A.


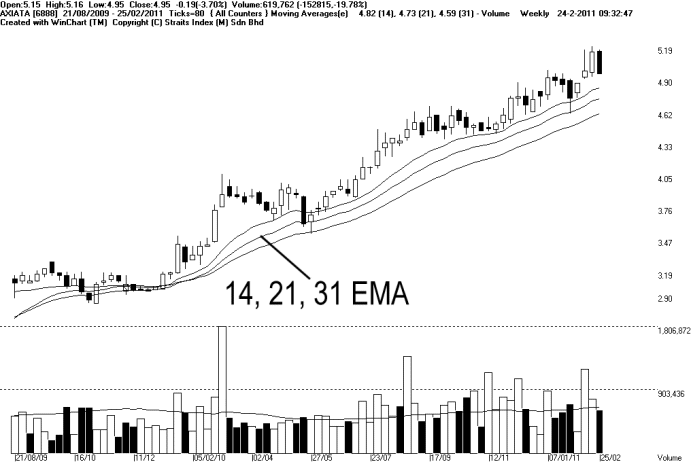
Chart 2A : Axiata – 6888 as at 20/04/2011. Weekly.

As indicated by A, on Chart 2A, since entering its uptrend in the middle of 2009, price of Axiata has been staying above the rising 14, 21, 31 Weekly EMA, a long term dynamic support. If price should break below this long term dynamic support, it suggests that the long term uptrend is violated. Thus a signal to consider to take profit.

4 Q Rolling PER

22.38 times

Dividend Yield

2.13%

Dividend


Dividend Yield

Net Profit Ratio

31/12/2010

10 sen

2.02%

11.33%

31/12/2009

0 sen

0.00%

12.61%

31/12/2008

0 sen

0.00%

4.39%

Table 1: Axiata – 6888, yearly dividend, dividend yield, and net profit ratio.

Benalec – 5190: Forming higher-low.


Chart 3: Benalec – 5190 as at 20/04/2011.

As shown on chart 3, price of Benalec broke above the 14, 21, 31 EMA on the 23rd of March, and rose all the way to RM 1.61. Price retreated as profit taking took place, but as indicated by A, the 14, 21, 31 EMA is still supporting the price, forming a higher-low. Meanwhile, the 14, 21, 31 EMA is also serving as the dynamic support.

Based on the chart of Benalac, price is likely to remain its short term uptrend, and investors could choose to hold. However, it is not time to use the 14, 21, 31 EMA yet, until price should start rising. As for new investors whom are interested in taking up position, the same strategy is applied here.

Nevertheless, if price should start rising, it will have to test the RM 1.57 ~ RM 1.61, and technically, to form an uptrend, price has to first form a higher-low, then followed by breaking its recent high, (new high).

Tenaga–5347: Weakness remains in consolidation.


Chart 4: Tenaga–5347 as at 20/04/2011.

As shown on chart 4, price of Tenaga has been testing the RM 5.95~RM 6.00 support many times, since February, 2011. With the support remains intact, it has prevented the downtrend of Tenaga from worsen, and price is entering a consolidation. However, lower-highs formation is still visible, as every time price rebounded from the support, the upper turning points are getting lower, which shows the weakness of the consolidation.

Technically, formation of lower-highs suggests weakness of the trend, but the other important factor that determines the downtrend is the break out below the RM 5.95~RM 6.00 support. It is usually not a good time to buy right now. Unless, price should break above the 14, 21, 31 EMA and later forms a higher-low.

Conclusion:

As illustrated by above examples, when stock price is testing the important support, it might seem like it is staying at a “lowest” point, but it is important for one to wait until it really starts forming an uptrend, then only buy. Buying too early while price is still testing the support is impulsive, and once stock price break below the support, selling pressure is expected to be strong.


Copyright © 2009 Straits Index (M) Sdn BhdImportant Disclaimer:These content provided by Straits Index (M) Sdn Bhd is solely for education and information purposes only, and do not suggest any investment advices. All information displayed are believed to be accurate and reliable. Interpretation of the data or analysis is at the reader's own risk. Straits Index (M) Sdn Bhd reserves the rights but obligations to update, admen, or even terminate the materials. 重要声明:以上的内容由海峡指数(马)私人有限公司提供,纯粹是教育性质, 并不是任何的投资忠告。所有资料显示认为是准确和可靠的。对数据或分析的解释和用途是在于用户自己的风险。海峡指数(马)有限公司持有保留及义务更新,甚 至终止材料的权利。

Monday, April 4, 2011

KLCI, Axiata, CIMB, UEMland

After the earthquake and Tsunami, the nuclear crisis in Japan is the main concern of investors around the world, with last week's Nikkei 225 index was falling up to 2000 points or 20%, and the regional markets were severely affected too. However, the Malaysian market was mildly affected.


Chart 1: KLCI as at 16/3/2011.

As shown on chart 1, although the KLCI was also affected by the negative impact of the Japan nuclear crisis, the downside movement of the KLCI was rather insignificant. As indicated by A, the KLCI had once broken below the 1474 support, but it managed to return to above the support level and this shows that the support for the KLCI remains at 1474~1480. If the KLCI could hold up above this level, the KLCI could prolong its sideways consolidation.

But still, with the KLCI below the 14, 21, 31 EMA the technical outlook for the KLCI remains on the lower side. If the KLCI should break below the 1474 again, it would be making a half year new low.

Understanding volume – continue.

Last week, we discussed the relationship of volume with price movement. This week, we shall look deeper into their relationship and the effect caused.

A: Price gain with volume up.

When price goes up associated with the rising of volume, we theoretically say that there are increased of new buyers (greed) to replace the old sellers (fear). Not only that, these new buyers are mostly paying a higher price to get in, and old sellers are asking for more premium to get out. This is a good sign, especially for break out of resistance. Study Chart 1A.

Chart 1 Airasia : Price up with volume.

B: Price up but volume unchanged:

When price continues to go up, but volume remains unchanged, or there are no significant increased of volume, it is rather normal. This shows that there is still positive volume flow as new buyers are basically still paying higher price to take their shares from old sellers. Provided volume stays almost the same, it is fine. Another factor we must consider is that when price is getting higher, the buying power of the same money is less. Therefore, it is getter harder and harder to get the equal amount of shares for the same money. However, when it comes to a break out of an important resistance, significant increased of volume is still in favor.

Next week, we shall continue in exploring other combination of price and volume. Below are this week's case studies.


Axiata – 6888: Possible Head and Shoulders Top.

Axiata – 6888 as at 16/03/2011.

The L1 line of Chart 2 outlines the formation of lower-high of Axiata, since 9th of March, and the technical outlook for Axiata remains negative since then. Fortunately, price of Axiata is still supported by the RM 4.70 support, thus the downtrend is not devastating. Together with the L1 line and the RM4.70 support, it forms a Descending Triangle, and the descending Triangle is a consolidation pattern with weakness, for it shows that price already formed lower-high, but support remains unchanged.

Meanwhile, over the course of 1 and a half month, price of Axiata is forming a Head and Shoulders Top. Technically, a Head and Shoulders Top pattern implies that it is the temporary peak of Axiata, and the risk of a reversal is high, and the key factor of the reversal would be a break down below its neck line, the RM 4.70 support.

Nevertheless, regardless of the fancy name of the given pattern, the right edge of a Head and Shoulder top is always a Descending Triangle, and therefore, provided one could identify this pattern and stay away from its weakness, he is saved. As for investors whom are still holding, it is a good idea to refer to the long term weekly chart, and if price should break below the weekly 14, 21, 31 EMA, it means that the long term uptrend has been violated, thus a sign to exit.

Of course, there is still a possibility that Axiata could stay above RM 4.70, and prolong its sideways consolidation. By then, it would have broken away from the L1 descending line, thus reducing the risk of a bearish reversal.

4 Q Rolling PER

22.71 times

Dividend Yield

2.10%

Dividend

Dividend Yield

Net Profit Ratio

31/12/2010

10 sen

2.07%

11.33%

31/12/2009

0 sen

0.00%

12.61%

31/12/2008

0 sen

0.00%

4.39%

Table 1: Axiata – 6888, yearly dividend, dividend yield, and net profit ratio.

CIMB – 1023: Short term weakness and testing RM 7.80 support.


Chart 3: CIMB – 1023 as at 16/03/2011.

As indicated by a, price of CIMB remains in a short term downtrend after breaking below the 14, 21, 31 EMA on the 21st of January. Therefore, the technical outlook for CIMB remains weak. It is a good idea to stay away from stocks which have negative technical outlook.

Meanwhile, price of CIMB is testing the RM 7.80 support and this is a support since August, 2010. If price should break below this support, it would be making a 7 months new low, and it means that all investors whom had bought within this 7 months will be making losses, or turning their profit into losses, thus increasing the selling pressure. Again, as long as price of CIMB is still trending below the 14, 21, 31 EMA, it is a not a good idea to “buy low”.

4 Q Rolling PER

16.16 Times

Dividend Yield

3.29%

Dividend

Dividend Yield

Net Profit Ratio

31/12/2010

26.07 sen

3.23%

 29.81%

31/12/2009

18.50 sen

1.46%

 26.31%

31/12/2008

25 sen

4.27%

 25.22%

31/12/2007

25 sen

2.27%

 31.00%

31/12/2006

15 sen

1.94%

 23.53%

Table 2: CIMB – 1023, yearly dividend, dividend yield, and net profit ratio.

Revision of last week's case study: UEMland – 5184: Still testing RM2.64 support.

Chart 4: UEMland – 5184 as at 16/03/2011.

Last week, we mentioned UEMLand's Descending Triangle, with weakness. Until now, the technical condition of UEMLand is unchanged, while the Descending Triangle remains intact. But, right now, price of UEMLand is staying at the edge of the Triangle, and usually the break out is not far away from now.

If price should break below the RM2.60 support, it would increase the selling pressure and by then, the 14, 21, 31 EMA would serve as the dynamic resistance, with negative technical outlook. Therefore, when price break below RM2.60, it is a signal to cut loss. On the other hand, if price of UEMland prolongs its consolidation, it would eventually break away the L1 line, and by then, the Descending triangle would be dysfunctional. In short, right now is not a good time to make any trading decision until a valid break out away from the L1 line.

4 Q Rolling PER

45.83 times

Dividend Yield

0.00%

Dividend


Dividend Yield

Net Profit Ratio

31/12/2010

0 sen

0.00%

41.42%

31/12/2009

0 sen

0.00%

28.44%

31/12/2008

0 sen

0.00%

14.50%

Table 3: UEMland – 5184, yearly dividend, dividend yield, and net profit ratio.

Conclusion:

As the market is generally affected by negative impact of the Japan nuclear incident, many counters are falling and price is definitely lower. However, this does not mean that it is a good time to pick up some of the cheap stocks, and if one should do this, he or she is actually going against the trend.


Copyright © 2009 Straits Index (M) Sdn BhdImportant Disclaimer:These content provided by Straits Index (M) Sdn Bhd is solely for education and information purposes only, and do not suggest any investment advices. All information displayed are believed to be accurate and reliable. Interpretation of the data or analysis is at the reader's own risk. Straits Index (M) Sdn Bhd reserves the rights but obligations to update, admen, or even terminate the materials. 重要声明:以上的内容由海峡指数(马)私人有限公司提供,纯粹是教育性质, 并不是任何的投资忠告。所有资料显示认为是准确和可靠的。对数据或分析的解释和用途是在于用户自己的风险。海峡指数(马)有限公司持有保留及义务更新,甚 至终止材料的权利。

KLCI, KLK, Genting, AXIATA

Due to worries in Libya as well as China raising interest rate, the Asian markets were affected, and many counters of local market are also affected. Especially, on the 22nd of February, there were 880 counters losing. (There were 905 counters losing on the 10 of March, 2008). Investors could do a simple math and figure the probabilities of picking a winner when losers outnumbered winner in such scale.

Chart 1: KLCI ast at 23/2/2011.

As indicated by A, the KLCI tested the T1 downtrend line, and also the 14, 21, 31 EMA dynamic resistance, and the KLCI retreated, and resumed its downtrend, within the downtrend channel of the T1 and T1 lines. Technically, provided that the KLCI is still trending below the 14, 21, 31 EMA, the technical outlook is still negative.

Although the KLCI is still trending down in the downtrend channel, it has not broken 1500 psychological support level. We would like to remind our readers that the characteristic of a downtrend formation is lower-High, and later new low. This is because, when price breaks new low, it means more investors (including those whom are already in profit) will be losing money, or turning their profit into losses. As a result, it will trigger more selling pressure, and create more negative memory in the downtrend.

As mentioned last week, if the KLCI could find its support above 1500, then the KLCI or the market would have a chance to temporary prevent the downtrend for getting worse, by forming a sideways consolidation. And if so, after a while, the new inflow of fresh capital will eventually neutralize some selling pressure, and then, the KLCI or the market would have a better position to start a new trend. In other words, if the KLCI could stay above 1480~1500, the bear is still away from sight. 

KLK – 2445: Testing important support.


Chart 2: KLK – 2445 as at 23/02/2011

As shown on chart 2, price of KLK has tested the RM22.98 (Rounding up to RM23) a few times, but still it failed to break above this resistance, and price of KLK started to decline after that. As indicated by A, price of KLK is now testing the RM20~RM21 support level, and this is a support for KLK since December, 2010.

If price of KLK should remain supported by RM20~RM21, it is likely that the sideways consolidation could extend, and as for those investors whom had bought earlier and at a lower price, they could choose to hold their position in profit. However, if price should break below the RM20 support, it means that all investors whom had bought in December, 2010, will eventually loss money, and this will trigger more selling as some of these investors might want to cut loss, or some are breaking even. In short, if the support is violated, more downside movement is likely for KLK.

4 Q Rolling PER

20.89 times

Dividend Yield

2.85%

Dividend

Dividend Yield

Net Profit Ratio

30/09/2010

60 sen

3.00%

13.51%

30/09/2009

40 sen

2.90%

9.20%

30/09/2008

70 sen

7.29%

13.25%

30/09/2007

50 sen

3.79%

13.70%

30/09/2006

50 sen

4.59%

11.06%

Table 1: KLK – 2445, yearly dividend, dividend yield, and net profit ratio.

Genting – 3182: Short term Downtrend.


Chart 3: Genting – 3182 as at 23/02/2011.

After touching its peak of RM11.98 on the 13th of January, price of Genting has been falling since then, forming a short term downtrend, and the 14, 21, 31 EMA is still serving as a dynamic resistance. Last week, price of Genting managed to rebound from the RM10 support level, but unfortunately, after the rebound, price of Genting remained resisted by the 14, 21, 31 EMA, and therefore, forming another lower-high, and the short term downtrend remains intact.

As indicated by A, if price of Genting should break below the RM10 support, it would be forming a new-low of 4 months, which fulfilled the characteristic of a downtrend (lower-high and new low). Technical outlook for Genting remains negative for now. And as long as price of Genting is still staying below the 14, 21, 31 EMA, it is a good idea to stay away from this stock.

4 Q Rolling PER

17.42 times

Dividend Yield

0.75%

Dividend

Dividend Yield

Net Profit Ratio

31/12/2010

7.8 sen

0.75%

14.50%

31/12/2009

7.2 sen

1.14%

11.74%

31/12/2008

7 sen

1.89%

6.27%

31/12/2007

37 sen

0.98%

12.15%

31/12/2006·

32 sen

0.97%

21.66%

Table 2: Genting – 3182, yearly dividend, dividend yield, and net profit ratio.

Axiata – 6888: Technical correction in long term uptrend.


Chart 4: [Axiata – 6888] as at 23/02/2011.

Like most of the blue chips counters, price of Axiata was affected by the sharp correction across the market. However, despite being affected by the correction, the long term uptrend of Axiata is still intact. This is because Axiata weekly chart is still staying above the 14, 21, 31 Weekly EMA long term dynamic support.

In other words, for those investors whom had bought this stock at a lower price, it is a good idea to continue to hold, provided that he or she should lift the trailing stop or profit taking level gradually according to the 14, 21, 31 Weekly EMA. Still, if any one should feel uncomfortable amid the market condition, he or she could choose to take profit partially, by selling 1/3 of the positions.

4 Q Rolling PER

23.57 times

Dividend Yield

2.02%

Dividend

Dividend Yield

Net Profit Ratio

31/12/2010

10 sen

2.02%

11.33%

31/12/2009

0 sen

0.00%

12.61%

31/12/2008

0 sen

0.00%

4.39%

Table 3: Axiata – 6888, yearly dividend, dividend yield, and net profit ratio.

Conclusion:

It is irrational to repeat the same actions with the same mindset, but every time expect a different result. A third person can see clearly that this is a dead-end in a maze, but the we, mouse inside the maze, have no idea. Since when, and who, instill the idea of "buy on dip" or "buy low sell high" into our mindset? And had we ever spent a considerable amount of time and dedication to explore the validity of such idea? We normal people are generally feeling more comfortable by sticking to old ideas, such as buying low, but ask ourselves honestly, didn't every we buy because we somehow believed that it was the lowest price at that moment? And we know the true result to that. It is easy to conceive the needs to change our trading mindset, to follow the direction of the market, not against it. Taking the action to change, on the other hand, takes real courage and honesty to one self.


Copyright © 2009 Straits Index (M) Sdn BhdImportant Disclaimer:These content provided by Straits Index (M) Sdn Bhd is solely for education and information purposes only, and do not suggest any investment advices. All information displayed are believed to be accurate and reliable. Interpretation of the data or analysis is at the reader's own risk. Straits Index (M) Sdn Bhd reserves the rights but obligations to update, admen, or even terminate the materials. 重要声明:以上的内容由海峡指数(马)私人有限公司提供,纯粹是教育性质, 并不是任何的投资忠告。所有资料显示认为是准确和可靠的。对数据或分析的解释和用途是在于用户自己的风险。海峡指数(马)有限公司持有保留及义务更新,甚 至终止材料的权利。

Thursday, March 31, 2011

JCY, Axiata, KNM

Despite the KLCI marked a 30 months new high, many counters are still falling while some even makes new low. Therefore, this shows that the recent rally is rather selectively on some heavy weighted index components while the overall market is not as much bullish.

Revision of Last week's Case Study: JCY - 5161: New Low again.


Chart 1: JCY - 5161 (11/05/2010 ~ 01/09/2010 )

As shown on chart 1, price of JCY is still falling, and breaking another historical new low, thus the downtrend remains intact and the 14, 21, 31 EMA is still serving as the dynamic resistance. Technical outlook for JCY is bearish.

As indicated by A, when price falls, volume increased significantly, this suggests that the selling pressure was high and seller rushed to sell off their share to new buyers whom are only willing to take up position at a lower price.

In short, heavy volume during a downtrend will further dampen the bearish sentiment on this counter, thus investors are urged not to try to catch the bottom, despite the falling of price, which appears to be cheap. Since price is breaking new low, no valid support is seen right now.

Leading PER

6.9 times

Dividend Yield

0%

Dividend

Earning Per Share

30/06/2009

0 sen

2.72 sen

31/03/2009

3.91 sen

3.22 sen

Table 1: JCY - 5161, Quarterly Dividend and Earning per Share.

Axiata – 6888: Uptrend continues, and new high.


Table 2: Axiata – 6888 (11/05/2010 ~ 01/09/2010)

Recently, the KLCI has been lifted by some heavy weighted index components, and one of them is Axiata. As shown on chart 2, price of Axiata remains above the 14, 21, 31 EMA, thus the uptrend remains intact.

In other words, for those who already bought this counter, it is a good idea to hold on to the position, until price should break below the 14, 21, 31 EMA, then it is a signal to take profit or the cut loss. As for those who are interested in taking up position, the idea entry point would be a formation of a higher-low; then, he or she must apply the 14, 21, 31 EMA as the trailing stop reference.

Nevertheless, as Axiata is breaking new high, next resistance for Axiata is at RM4.70 followed by RM5.00 level, while the 14, 21, 31 EMA is still serving as the dynamic support.

4 Q Rolling PER

14.68 times

Dividend Yield

0.00%

Dividend

Dividend Yield

Net Profit Ratio

31/12/2009

0 sen

0 %

12.61%

31/12/2008

0 sen

0 %

4.39 %

Table 2: Axiata – 6888, yearly dividend, dividend yield, and net profit ratio.

KNM – 7164: New low.


Table 3: KNM – 7164 (11/05/2010 - 01/09/2010)

As shown on chart 3, KNM has been moving sideways above the RM0.48~RM0.50 level for about 3 months, and this has built up a considerable memory for traders ( either those who are holding or who are watching on the sidelines). As indicated by A, price breaks below the RM0.48~RM0.50 support, making a new low. This means that all these investors who had bought at around RM0.48~RM0.50 in the past 3 months are all turning their profit (if any) into losses, thus creating a big negative impact.

It is devastating to think that this massive fall of share price is a big discount, and when one should start buying while price started to fall, he is trading against the trend. This is because all these traders who had bought this share earlier are mostly wanted to break even, hence the selling pressure is strong.

Technically, provided that price is still staying below the 14, 21, 31 EMA, the technical outlook for KNM is on the negative side, and despite the falling of share price, there is no reliable support level for now.

4 Q Rolling PER

31.43 times

Dividend Yield

0 %

Dividend

Dividend Yield

Net Profit Ratio

31/12/2009

0 sen

0 %

9.37%

31/12/2008

1.5 sen

3.7 %

13.30%

31/12/2007

4.0 sen

0.52 %

16.29%

31/12/2006

5.0 sen

0.57 %

14.56%

31/12/2005

5.0 sen

1.40 %

11.97%

Table 3: KNM – 7164, yearly dividend, dividend yield, and net profit ratio.

Conclusion:
Technical analysis is not just only a statistic of price movement, it also reflects traders' memory as well as psychology. One does not only study himself when he decides to take up a new position, he has to study what the losers or the winners are taking, and what losers and winners wants. Therefore, this explains why we need to trade with a trend, and avoid trading against it.


Copyright © 2009 Straits Index (M) Sdn BhdImportant Disclaimer:These content provided by Straits Index (M) Sdn Bhd is solely for education and information purposes only, and do not suggest any investment advices. All information displayed are believed to be accurate and reliable. Interpretation of the data or analysis is at the reader's own risk. Straits Index (M) Sdn Bhd reserves the rights but obligations to update, admen, or even terminate the materials. 重要声明:以上的内容由海峡指数(马)私人有限公司提供,纯粹是教育性质, 并不是任何的投资忠告。所有资料显示认为是准确和可靠的。对数据或分析的解释和用途是在于用户自己的风险。海峡指数(马)有限公司持有保留及义务更新,甚 至终止材料的权利。

Thursday, September 2, 2010

Bjcorp, Axiata, EO

As the performance of the KLCI continues to improve, coupled with total market volume staying above the 40-day VMA level, the market sentiment is looking better. But, there are still counters failing to form an uptrend. Let's study some of the case studies.

BJcorp – 3395: Technical Rebound.

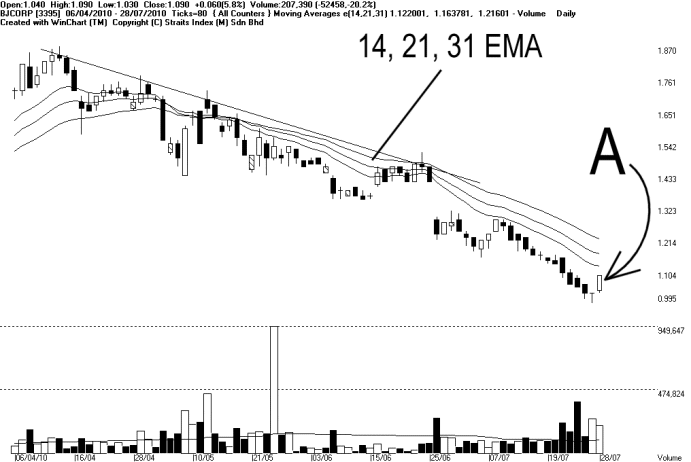
Chart 1: BJcorp – 3395 (06/04/2010 ~ 28/07/2010)

As indicated by A, price of Bjcorp rebounded on Wednesday, but it was only a technical rebound, for it is still resisted by the 14, 21, 31 EMA, which is still serving as the dynamic resistance. Therefore, the downtrend remains intact.

As shown on the chart above, there were many technical rebound during this course of downtrend, but each rebound failed to break above the dynamic resistance, and later formed a lower-high. Which is the characteristic of a downtrend.

If price should rebound but resisted by the 14, 21, 31 EMA again, it means that the downtrend is still in place, thus no buying signal yet. As for those who wanted to catch a rebound, do note that the risk is catching a rebound is high. If price should start falling again, and later break below RM0.995, itwoudl be making a new low.

Technically, the most ideal buy signal would be a valid break out above the 14, 21, 31 EMA, then followed by a mild retreat of price with thin volume, and then a rebound above the 14, 21, 31 EMA with strong volume, forming a higher-low. Nevertheless, support for Bjcorp is at RM 0.995 or RM1.00 while the resistance is still the 14, 21, 31 EMA.

4 Q Rolling PER

53.17 times

Dividend Yield

0.92%

Dividend

Dividend Yield

Net Profit Ratio

30/4/2010

1 sen

0.79 %

1.23 %

30/4/2009

3.35 sen

3.99 %

-0.83%

30/4/2008

9 sen

8.11 %

17.20 %

30/4/2007

0 sen

0 %

5.75 %

30/4/2006

0 sen

0 %

-24.33 %

Table 1: Bjcorp, yearly dividend, dividend yield and net profit ratio.

Axiata – 6888: Testing New High.

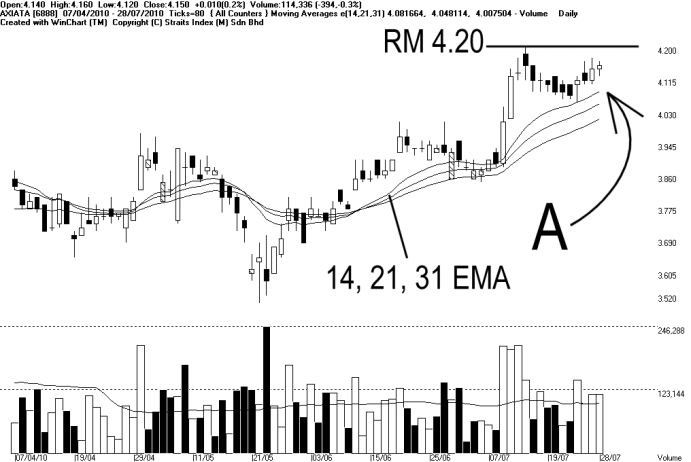
Chart 2: Axiata – 6888 (07/04/2010 ~ 28/07/2010)

After breaking above the RM3.80 resistance, it formed an uptrend, and at the same time staying above the 14, 21, 31 EMA. As shown on chart 2, it hit a high on the 14thof July, at RM4.20, and price retreated later with lesser volume. After the retreat, it managed to rebound again from the 14, 21, 31 EMA, as indicated by A, thus the uptrend is remains intact.

Currently, Axiata is about to test the RM4.20 resistance again, and if it could break above the RM4.20 it would be making a 20 months new high, and the uptrend shall continue. However, a strong volume is needed to confirm such breakout. If price should break out RM4.20 with thin volume, there is a risk of a false break out.

Nevertheless, if price should break above RM4.20, it would be a good idea to hold on to the position for those who are already in positions. As for those who are waiting to buy, an ideal buy signal would be at a higher-low. Next resistance is seen at RM5.00.

4 Q Rolling PER

13.83 times

Dividend Yield

0 %

Dividend

Dividend Yield

Net Profit Ratio

31/12/2009

0 sen

0 %

12.61%

31/12/2008

0 sen

0 %

4.39%

Table 2: Axiata – 6888, yearly dividend, dividend yield, and net profit ratio.

Revision of last week's Case Study: E&O – 3417: In uptrend.

Chart 3: E&O – 3417 (07/04/2010 ~ 28/07/2010)

As shown on chart 3, ever since breaking above the 14, 21, 31 EMA, E&O formed an uptrend, while supported by the 14, 21, 31 EMA. As indicated by A, after breaking above the L1 downtrend line, until now it has not had any correction yet, but instead, the rally speed up, with its price currently about 10% above the 14, 21, 31 EMA level. Therefore, as the rally speed up, it is a wiser move to tighten stop loss level. For the correction could be a sharp one.

Since the rally is speeding up, it might not be too practical to apply the 14, 21, 31 EMA as a trailing stop reference. Therefore, it would be more practical to apply “yesterday's low” as the trailing stop reference.

In short, if price should continue to rally, investors will continue to hold their share, but lift the stop loss level to yesterday's low. If price should retreat and break below yesterday's low, it would be a signal to take profit, or partial profit taking. Until the price should move sideways, then the 14, 21, 31 EMA trailing stop reference would resume.

4 Q Rolling PER

16.37 time

Dividend Yield

3.49%

Dividend

Dividend Yield

Net Profit Ratio

31/03/2010

3.8 sen

4.29%

20.12%

31/03/2009

0 sen

0%

-12.45%

31/03/2008

5 sen

2.78%

24.95%

31/03/2007

4 sen

1.84%

5.76%

31/03/2006

0 sen

0%

12.93%

Table 3: E&O – 3417, yearly dividend, dividend yield, and net profit ratio.

Conclusion:

Despite the KLCI is gaining strength, not all counters are moving in uptrend. Therefore, it is very important that one should pick stock carefully, and avoid stocks still trending in downtrend. As for taking up new position, it is crucial to set up an trading and cut loss plan.


Copyright © 2009 Straits Index (M) Sdn BhdImportant Disclaimer:These content provided by Straits Index (M) Sdn Bhd is solely for education and information purposes only, and do not suggest any investment advices. All information displayed are believed to be accurate and reliable. Interpretation of the data or analysis is at the reader's own risk. Straits Index (M) Sdn Bhd reserves the rights but obligations to update, admen, or even terminate the materials. 重要声明:以上的内容由海峡指数(马)私人有限公司提供,纯粹是教育性质, 并不是任何的投资忠告。所有资料显示认为是准确和可靠的。对数据或分析的解释和用途是在于用户自己的风险。海峡指数(马)有限公司持有保留及义务更新,甚 至终止材料的权利。

Wednesday, August 25, 2010

Unisem, Axiata, IRCB

Total market volume continues to stay below the 40-day VMA level, suggesting that the market is indeed very quiet, as inflow of fresh capital is slow. With the KLCI now below the Bollinger Middle Band, the immediate technical outlook for the KLCI is on the negative side, and therefore, most counters are likely to trend down. Nevertheless, we shall continue staying some Case Studies

UNISEM – 5005: Forms a Symmetrical Triangle.

Chart 1: UNISEM – 5005 (18/01/2010 ~ 30/06/2010 )

As shown on chart 1, price of Unisem rebounded on the L1 line on the 26th of May, and later breaking above the 14, 21, 31 EMA, and resumed its uptrend movement. However, price failed to test its recent high, and instead, forming a lower high at RM3.25 level, L2 line. Therefore, it has formed a Symmetrical Triangle. This suggests a consolidation for Unisem.

The characteristic of a Symmetrical Triangle is that the fluctuation of price is getting lower as the price moves towards the right side of the Triangle, and the direction shall remains unclear, until a valid break out, above or below the Symmetrical Triangle. If price should break above the L2 line, with strong volume, then the 14, 21, 31 EMA would resumes its role as a dynamic support for the rally of Unisem.

Other wise, if price should break below the L1 line, it would means an end of the uptrend, but this signal does not need a strong volume to confirm. Then, the 14, 21, 31 EMA would be serving as the dynamic resistance for the falling price.

4 Q Rolling PER

11.23 times

Dividend Yield

0.88%

Dividend

Dividend Yield

Net Profit Ratio

31/12/2009

2.5 sen

1.14 %

5.97 %

31/12/2008

2.5 sen

3.57 %

1.61%

31/12/2007

10 sen

6.06 %

12.25 %

31/12/2006

10 sen

6.06 %

10.38 %

31/12/2005

8 sen

5.76 %

3.92 %

Table 1: UNISEM – 5005, yearly dividend, dividend yield, and net profit ratio.

AXIATA – 6888: Capped by RM3.95~RM 4.00 Resistance.

Chart 2: AXIATA – 6888 (10/02/2010 ~ 30/06/2010)

As shown on chart 2, price of Axiata tested the RM3.95~RM4.00 resistance many times, and until now, it is still being resisted by this level. Therefore, it is believed that many investors have formed a memory at this level, thus creating a selling pressure when price approach this level.

Technically, if price would break above this level, more volume is needed, as more volume suggests more inflow of fresh capital to off set the selling pressure. If price should really break above the RM3.95~Rm4.00 resistance, then the 14, 21 ,31 EMA would continue serving as the dynamic support, as well as the trailing stop reference of the rally.

On the contrary, if price should remain resisted by the RM3.95~RM4.00 level again, and later break below the 14, 21, 31 EMA, it would be a signal suggesting that the price movement of Axiata could be turning negative, and support would be at RM3.60 level.

4 Q Rolling PER

13.07 times

Dividend Yield

0.00 %

Dividend

Dividend Yield

Net Profit Ratio

31/12/2009

0 sen

0 %

12.61 %

31/12/2008

0 sen

0 %

4.39 %

Table 2: AXIATA – 6888, yearly dividend, dividend yield, and net profit ratio.

IRCB – 2127: Still being supported.

Chart 3: IRCB – 2127 (10/03/2010 ~ 30/06/2010)

As shown on chart 3, price of IRCB is still supported by the T1 uptrend line, in spite of the profit taking activities. With the price o f IRCB still above the 14, 21, 31 EMA, the immediate technical outlook is still on the positive side, and therefore, for those who are holding this stock, it is a good idea to hold on to it as long as the 14, 21, 31 EMA is still supporting the price. If price should break below the 14, 21 ,31 EMA, it would be a signal to cut loss, or to take profit.

As for those who are looking to but this stock, there is no buy signal for the moment. Technically, price have to rebound from the 14, 21, 31 EMA, and form and higher-low, then only it is a buy signal, which suggesting a chance of continuation of the existing uptrend. Immediately after buying, investors should set a trailing stop by using the 14, 21 ,31 EMA as a reference.

4 Q Rolling PER

98.73 times

Dividend Yield

0%

Dividend

Dividend Yield

Net Profit Ratio

31/01/2010

0 sen

0%

3.56%

31/01/2009

0 sen

0%

-3.83%

31/01/2008

0 sen

0%

-16.09%

31/01/2007

0 sen

0%

-5.36%

31/01/2006

0 sen

0%

0.15%

Table 3: IRCB – 2127, yearly dividend, dividend yield, net profit ratio.

Conclusion:
Although the KLCI has not formed a downtrend, total market volume remains low, and this suggests that the investors' confidence is still low, thus the KLCI is likely to stay weak. If volume should remains low, there won't be sufficient inflow of fresh capital to off set the selling pressure. Therefore, it is generally harder for any stock to sustain its uptrend. It is important to honor your trading and cut loss plan.


Copyright © 2009 Straits Index (M) Sdn BhdImportant Disclaimer:These content provided by Straits Index (M) Sdn Bhd is solely for education and information purposes only, and do not suggest any investment advices. All information displayed are believed to be accurate and reliable. Interpretation of the data or analysis is at the reader's own risk. Straits Index (M) Sdn Bhd reserves the rights but obligations to update, admen, or even terminate the materials. 重要声明:以上的内容由海峡指数(马)私人有限公司提供,纯粹是教育性质, 并不是任何的投资忠告。所有资料显示认为是准确和可靠的。对数据或分析的解释和用途是在于用户自己的风险。海峡指数(马)有限公司持有保留及义务更新,甚 至终止材料的权利。

Wednesday, March 24, 2010

CIMB, Axiata, Genting, LCL, and Bursa.

The KLCI rebounded strongly, and breaking above the 14, 21, 31 Exponential Moving Average – EMA, as indicated by A. Meanwhile, the Bollinger Bands expanded, with the KLCI above the Bollinger Middle Band, thus giving a bullish signal. Technically, the KLCI is still lacking of one important bullish condition, which is the volume. (Please refer to arrow B).


Chart 1: KLCI chart from 27/10/2009 to 24/02/2010.

Based on the statistic in the past, if the KLCI should rally without volume reaching above the 40-day VMA level, it suggests that the rally is only selectively, and not a strong bullish market. Therefore, there are some counters gaining, while many counters are actually still trending down. Investors should carefully select the stocks that follow the broad market and avoid the stocks which are trending down.

Stocks that follow the market flow:

AXIATA

Chart 2: Axiata, from 27/10/2009 to 24/02/2010.

As indicated by A, price of Axiata followed the KLCI rebound, while continuously being supported by the 14, 21, 31 EMA, and tested the RM 3.50 resistance level. If price of Axiata should break above this resistance, it would be making a new high, thus suggesting a continuation of the uptrend. However, a valid break out has to be confirmed with strong volume, and provided that price of Axiata is still staying above the rising 14, 21, 31 EMA, it is a good idea to keep the stocks as the uptrend remains intact. If price should break below the 14, 21, 31 EMA, it would be a signal to take profit or to cut loss. If price should break above the RM 3.50 level, the next resistance for Axiata is seen at RM 4.10.

Leading PER

17.05 times

Dividend Yield

0%

Dividend

Dividend Yield

Net Profit Ratio

31/12/2008

0 sen

0%

4.39%

Table 1: Axiata, yearly dividend, dividend yield, and net profit ratio.

CIMB

Chart 3: CIMB, from 27/10/2009 to 24/02/2010.

As indicated by A, the CIMB gapped up and breaking above the 14, 21, 31 EMA dynamic resistance, with strong volume, therefore, it is likely that CIMB could resume its uptrend movement. Technically, a strong volume is needed to confirm a valid break out, as the increased of volume suggests more inflow of fresh capital, new buying interest to off-set the selling pressure. If volume is low during a break out, the break out would not be confirmed.

If price of CIMB should remain supported by the 14, 21, 31 EMA, the uptrend is still intact, and it is a good idea to hold the stock, until the price should break below 14, 21, 31 EMA, it would be a signal to take profit. Next resistance for CIMB isat RM 13.58.

4 Q Rolling PER

15.92 times

Dividend Yield

1.46%

Dividend

Dividend Yield

Net Profit Ratio

31/12/2009

18.5 sen

1.46%

26.31%

31/12/2008

25 sen

4.27%

25.22%

31/12/2007

25 sen

2.27%

31.00%

31/12/2006

15 sen

1.94%

23.53%

31/12/2005

15 sen

2.63%

17.51%

Table 2: CIMB, yearly dividend, dividend yield, and net profit ratio.

Stocks going against the broad market:

LCL

Chart 4: LCL, from 27/10/2009 to 24/02/2010.

As shown on Chart 4, the Bollinger Bands of LCL contracted, suggesting that LCL is consolidating while preparing for a new movement. As indicated by A, the Bollinger Bands re-expanded with the price below the Bollinger Bands, thus giving a bearish signal. If the Bollinger Bands should continue to expand with price staying below the Bollinger Middle Band, more downside movement is expected. Support for LCL is at RM0.12 while the Bollinger Middle Band is serving as the dynamic resistance.

4 Q Rolling PER

-0.08 times

Dividend Yield

0%

Dividend

Dividend Yield

Net Profit Ratio

31/12/2009

0 sen

0%

-126.96%

31/12/2008

0 sen

0%

2.01%

31/12/2007

10 sen

1.56%

7.41%

31/12/2006

10 sen

6.06%

7.62%

31/12/2005

0 sen

0%

7.00%

Table 3: LCL yearly dividend, dividend yield, and net profit ratio.

GENTING

Chart 5: Genting, from 27/10/2009 to 24/02/2010.

As shown on chart 5, price of Genting continued its downtrend movement, after breaking below the RM 6.60 support. As indicated by A, the 14, 21, 31 EMA is still falling while serving as the dynamic resistance, and technically, as long as price is still staying below the 14, 21, 31 EMA, the downtrend shall remains intact.

Despite being a component of the KLCI, price of Genting failed to rebound together with the KLCI. This proves that the importance of identifying a stock that moves along with the direction of the broad market, investors can not just pick any KLCI component counters.

4 Q Rolling PER

34.44 time

Dividend Yield

1.11%

Dividend

Dividend Yield

Net Profit Ratio

31/12/2008

7 sen

1.89%

6.27%

31/12/2007

37sen

0.98%

12.15%

31/12/2006

32sen

0.97%

21.66%

31/12/2005

29sen

1.36%

22.86%

31/12/2004

24sen

1.26%

19.97%

Table 4: Genting, yearly dividend, dividend yield, and net profit ratio.

BURSA

Chart 6: Bursa, from 27/10/2009 to 24/02/2010.

As shown on chart 6, price of Bursa did not rebound, despite the strong rebound of the KLCI, and it is still staying below the falling 14, 21, 31 EMA, thus showing that the downtrend is still intact. Currently, as indicated by A, support for Bursa is at RM 7.17 level, and if price should break below this level, it would be making a new low, and more downside risk is expected as the downtrend remains intact.

4季滚动本益比
4 Q Rolling PER

21.66

周息率 (Dividend Yield

2.62%

股息 (Dividend

周息率 (Dividend Yield

净利润率(Net Profit Ratio

20091231

19.10

2.46%

44.13%

2008 1231

24.30

4.72%

31.48%

2007 1231

85.00

5.94%

48.91%

2006 1231

54.50

6.77%

41.55%

20051231

20.00

5.46%

42.13%

Table 5: Bursa yearly dividend, dividend yield, and net profit ratio.

Conclusion:
It is important to note that to follow the broad market flow, one should pick stocks that have the similar movement, and simply picking any KLCI component or any blue chips is not the way.


Copyright © 2009 Straits Index (M) Sdn BhdImportant Disclaimer:These content provided by Straits Index (M) Sdn Bhd is solely for education and information purposes only, and do not suggest any investment advices. All information displayed are believed to be accurate and reliable. Interpretation of the data or analysis is at the reader's own risk. Straits Index (M) Sdn Bhd reserves the rights but obligations to update, admen, or even terminate the materials. 重要声明:以上的内容由海峡指数(马)私人有限公司提供,纯粹是教育性质, 并不是任何的投资忠告。所有资料显示认为是准确和可靠的。对数据或分析的解释和用途是在于用户自己的风险。海峡指数(马)有限公司持有保留及义务更新,甚 至终止材料的权利。