Lionind: Waiting for breakout Resistance of Ascending Triangle:

Chart 1: Lionind (01/12/2009~31/03/2010)
Price of Lionind formed an Ascending Triangle, with the T1line being the dynamic support, and the resistance is at RM 1.85 level. An Ascending Triangle it self is an short-mid term uptrend biased consolidation but with limited upside room due to the resistance. And the characteristic of an Ascending Triangle is that the fluctuation of price will get narrower and narrower as it moves towards the tip of the triangle.
Technically, whenever price rebound from T1 line, it is forming a Higher-low, suggesting that the uptrend is still intact, but price would still need to break above the RM1.85 resistance in order to make room for a healthy uptrend.
If price should rebound form the T1 line and also break above RM1.85 resistance, it would be an end to the consolidation, and a good chance for the uptrend to continue. However, this has to be confirmed with strong volume at the break out, or it could be a “false breakout”. Nevertheless, if investors or trader were to apply the 14, 21, 31 EMA as a trailing stop method, the trading risk is still minimal. Provided that price of Lionind is still supported by the 14, 21, 31 EMA, the uptrend remains intact, and if price should break below the 14, 21, 31 EMA, it would be a signal to take profit or to cut loss.
| Leading PER | 4.16 times | Dividend Yield | 0.56% |
| Dividend | Dividend Yield | Net Profit Ratio | |
| 30/06/2009 | 1 sen | 0.8% | -6.06% |
| 30/06/2008 | 1 sen | 0.38% | 12.43% |
| 30/06/2007 | 1 sen | 0.57% | 4.36% |
| 30/06/2006 | 0.5 sen | 0.52% | -0.29% |
| 30/06/2005 | 1 sen | 0.81% | 8.26% |
Table 1: Lionind, yearly dividend, dividend yield, and net profit ratio.
E&O: Waiting for form a higher-low:
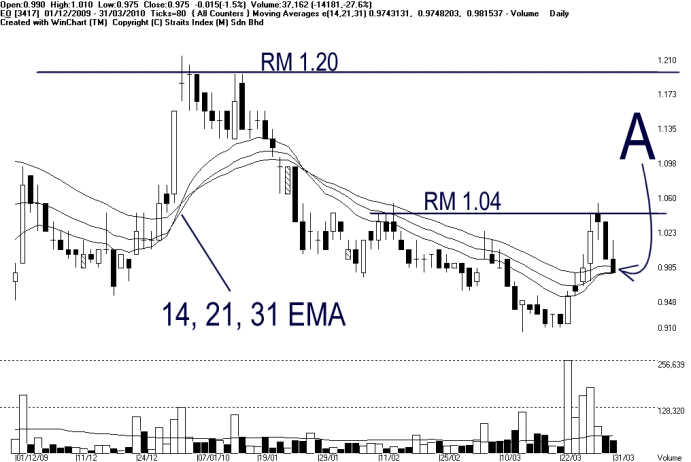
Chart 2: E&O (01/12/2009~31/03/2010)
As shown on chart 2, price of E&O rebounded from the RM0.91 level, and breaking above the 14, 21, 31 EMA. However, it hits a resistance at RM1.04 level, as profit taking took place. As indicated by A, price retreated after hitting the resistance at RM1.04 but now testing the 14, 21, 31 EMA.
If price should rebound from th 14, 21, 31 EMA, there is a good chance that it would form a Higher-low, which is the first technically criteria of an uptrend. However, when price form a higher-lower, a strong volume is needed, and it would be an ideal condition. After forming an higher-lower, the immediate target would be RM1.04 level, and it would require strong volume again to break above the RM1.04 resistance.
Technically, when it forms a Higher-low, it would be a first buy signal, with the 14, 21, 31 EMA being the dynamic support as well as a trailing stop, and provided that price could stay above the 14, 21, 31 EMA, there is a chance of an uptrend formation, and until price should break below the 14, 21, 31 EMA, then, it would be a signal to take profit or to cut loss.
| Leading PER | 29.35 times | Dividend Yield | 0% |
| Dividend | Dividend Yield | Net Profit Ratio | |
| 31/3/2009 | 0 sen | 0% | -12.45% |
| 31/3/2008 | 5 sen | 2.78% | 24.95% |
| 31/3/2007 | 4 sen | 1.84% | 5.76% |
| 31/3/2006 | 0 sen | 0% | 12.93% |
| 31/3/2005 | 0 sen | 0% | 9.3% |
Table 2: E&O, yearly dividend, dividend yield, and net profit ratio.
OSK: Uptrend intact:

Chart 3: OSK (5/1/2010~31/03/2010)
As indicated on Chart 3, price of OSK formed the T1 uptrend, while the 14, 21, 31 EMA is still supporting the uptrend and serving as the dynamic support. As indicated by A, price consolidated after rebound from the T1 line, and this is a very typical behavior of a healthy uptrend. Provided that the price should remain supported by the T1 or the 14, 21, 31 EMA, the uptrend remains intact.
Immediate resistance for OSK is at RM1.40 level, and the next resistance is seen at RM1.46. Technically, volume has to increase in order to support the break out, while the 14, 21, 31 EMA serves as the trailing reference.
| 4 Q Rolling PER | 7.95 times | Dividend Yield | 8.81% |
| Dividend | Dividend Yield | Net Profit Ratio | |
| 31/12/2009 | 7.5 sen | 6.1% | 13.73% |
| 31/12/2008 | 7.5 sen | 7.58% | 16.59% |
| 31/12/2007 | 20 sen | 8.62% | 21.38% |
| 31/12/2006 | 12.5 sen | 6.38% | 23.84% |
| 31/12/2005 | 7.5 sen | 7.85% | 13.52% |
Table 3: OSK, yearly dividend, dividend yield, and net profit ratio.
Conclusion:
When the broad market is trending up, many individual counters would be forming uptrend as well, but investors should never carelessly picking any stock. It is important to know that a healthy uptrend should have higher-lows and breaking new highs, together with the confirmation of volume, or else, they could be giving false break out signal.
Copyright © 2009 Straits Index (M) Sdn BhdImportant Disclaimer:These content provided by Straits Index (M) Sdn Bhd is solely for education and information purposes only, and do not suggest any investment advices. All information displayed are believed to be accurate and reliable. Interpretation of the data or analysis is at the reader's own risk. Straits Index (M) Sdn Bhd reserves the rights but obligations to update, admen, or even terminate the materials. 重要声明:以上的内容由海峡指数(马)私人有限公司提供,纯粹是教育性质, 并不是任何的投资忠告。所有资料显示认为是准确和可靠的。对数据或分析的解释和用途是在于用户自己的风险。海峡指数(马)有限公司持有保留及义务更新,甚 至终止材料的权利。