Thursday, May 20, 2010

Case Studies Unisem. MKland, Leader.

After making a new high for nearly two years, the KLCI started its technical correction. As the broad market having its correction, many individual counters are also having a similar correction.

Unisem-5005: Remains in uptrend.

Chart1: Unisem-5005 (15/12/2009~14/04/2010)

As indicated by A, price of Unisem has been supported by the 14, 21, 31 EMA, and the uptrend remains intact. Meanwhile, it has broken above several new highs. As indicated by B, whenever price broke new high, volume increased significantly, which provide the required uptrend technical condition.

Currently, price of Unisem is testing the RM3.22 resistance level. If price should break above the RM3.22 level with strong volume, it would mark another new high, thus the 14, 21, 31 EMA shall continue serving as the dynamic support as well as the trailing stop reference.

In other words, provided that price of Unisem is still supported by the rising 14, 21, 31 EMA, investors can choose to hold, all the way until price should break below the 14, 21, 31 EMA, then, it would be a signal to take profit or the cut loss.

4 Q Rolling PER

25.17 times

Dividend Yield

0.83%

Dividend

Dividend Yield

Net Profit Ratio

31/12/2009

2.5 sen

1.14%

5.97%

31/12/2008

2.5 sen

3.57%

1.61%

31/12/2007

10 sen

6.06%

12.25%

31/12/2006

10 sen

6.06%

10.38%

31/12/2005

8 sen

5.76%

3.92%

Table 1: Unisem, yearly dividend, dividend yield, and net profit ratio.

MKLand-8893:Might be forming a higher-low.

Chart 2: MKLand-8893 (15/12/2009~14/04/2010)

As shown on chart 2, price of MKLand broke above the RM0.37 resistance level, but due to profit taking activities, price of MKLand failed to stay above the RM0.37 level, and pulled back, breaking below the RM0.37 again. However, as indicated by A, price of MKLand managed to found its temporay support at the 14, 21, 31 EMA. This suggests that the 14, 21, 31 EMA is still serving as the dynamic support.

Meanwhile, as indicated by B, as price pulled back, volume declined, suggesting that the selling pressure was not huge, and technical, this is a healthy pullback.

If price should rebound from the 14, 21, 31 EMA, it would form another Higher-low, thus a good chance to resume its uptrend, and re-test the RM0.37 resistance line. But it has to be confirmed with a strong volume, then the 14, 21, 31 EMA shall continue serving as the dynamic support as well as the trailing stop reference. However, if price should break below the 14, 21, 31 EMA, it would be an up of the uptrend, thus a signal to cut loss. Next support is seen at RM0.32 level while the next resistance is found at RM0.46 level.

4 Q Rolling PER

33.18 times

Dividend Yield

0.00%

Dividend

Dividend Yield

Net Profit Ratio

30/06/2009

0 sen

0%

7.42%

30/06/2008

0 sen

0%

-41.02%

30/06/2007

0 sen

0%

5.12%

30/06/2006

1 sen

1.49%

11.57%

30/06/2005

4 sen

3.64%

13.28%

Table 2: MKLand-8893, yearly dividend, dividend yield, and net profit ratio.

Leader-4529 : Consolidation within an uptrend.


Chart 3:Leader-4529 (15/12/2009~14/04/2010)

After breaking above the Ascending Triangle, price of Leader has been consolidating for about two weeks, and currently preparing for its new movement. Technically, now is the time to use the Bollinger Bands to monitor its consolidation. This is because when the Bollinger Bands contracted for a certain period of time, the re-expansion signal is usually much clearer.

In other words, if the Bollinger Bands should re-expand, it would mark an end to the consolidation, and a beginning of a new movement. If price should stay above the Bollinger Middle Band, it would be a bullish signal, and the uptrend shall resume. If price should stay below the Bollinger Middle Band, it would be a bearish signal, thus a signal suggesting some profit taking.

As indicated by A, if price of Leader should stay above the Bollinger Middle Band, then, the 14, 21, 31 EMA shall continue serving as the dynamic support as well as the trailing stop reference. Next resistance for Leader is seen at RM1.05 level while the support is at RM1.00 psychological level.

4 Q Rolling PER

27.87 times

Dividend Yield

2.45%

Dividend

Dividend Yield

Net Profit Ratio

31/12/2009

2.5 sen

2.72%

0.64%

31/12/2008

2.5 sen

2.53%

1.02%

31/12/2007

4.5 sen

1.20%

4.94%

31/12/2006

7.5 sen

2.88%

3.06%

31/12/2005

4 sen

5.76%

2.68%

Table 3: Leader, yearly dividend, dividend yield, and net profit ratio.

Conclusion:

As the broad market started its technical correction, many individual counters will have a similar correction. However, investor not to over-worry as a correction is needed after a rally. Provided one should know how to apply a trialing stop properly and know when to get out, the trading risk is pretty much controlled by individual.


Copyright © 2009 Straits Index (M) Sdn BhdImportant Disclaimer:These content provided by Straits Index (M) Sdn Bhd is solely for education and information purposes only, and do not suggest any investment advices. All information displayed are believed to be accurate and reliable. Interpretation of the data or analysis is at the reader's own risk. Straits Index (M) Sdn Bhd reserves the rights but obligations to update, admen, or even terminate the materials. 重要声明:以上的内容由海峡指数(马)私人有限公司提供,纯粹是教育性质, 并不是任何的投资忠告。所有资料显示认为是准确和可靠的。对数据或分析的解释和用途是在于用户自己的风险。海峡指数(马)有限公司持有保留及义务更新,甚 至终止材料的权利。

Case Studies [EPMB] [LG] [OSK]

Most of the time, there are consolidation or correction during any uptrend. While the KLCI is testing the L1 resistance line (refer to the KLCI daily analysis), many of the counters will be having their consolidation as well. What should investors do when the KLCI is having its correction?

[EPMB-7773]: Breaking above resistance, might be forming an uptrend.


Chart 1:EPMB-7773 (01/12/2009~31/03/2010)

As shown on chart 1, price of EPMB formed an Ascending Triangle, with price forming a short term uptrend line but remained resisted by the RM0.525 level. As indicated by A, price of EPMB broke above the RM0.525 level and broke away from its consolidation.

However, as profit taking kicked in, price retraced as a pull-back effect, and it managed to stay above the RM0.525 level. Meanwhile, during the pullback effect, volume also declined as it suggests that the selling pressure was not high.

Technically, if price should rebound from the 14, 21, 31 EMA, the uptrend is expected to resume, and then the 14, 21, 31 EMA shall continue serving as the dynamic support as well as the trailing stop reference. However, if price should break below the 14, 21, 31 EMA, it would means the uptrend has failed, thus a signal to take profit or the cut loss.

4 Q Rolling PER

12.79 times

Dividend Yield

0.02%

Dividend

Dividend Yield

Net Profit Ratio

31/12/2009

0.1 sen

0.02%

1.51%

31/12/2008

0 sen

0%

1.73%

31/12/2007

0 sen

0%

-0.17%

31/12/2006

0 sen

0%

1.26%

31/12/2005

4.5 sen

6.82%

6.36%

Table 1: EPMB yearly dividend, dividend yield, and net profit ratio.

Revision of previous Case Study: L&G – 3147: Pull back.

Chart 2: L&G-3174 (01/12/2009~31/03/2010)

As shown on chart 2, price of L&G pulled back after breaking above the RM0.515 resistance level. Therefore, the break out above the RM0.515 has failed. Fortunately, price of L&G managed to be supported by the 14, 21, 31 EMA, as indicated by A, and this suggests that the 14, 21, 31 EMA is still serving as the dynamic support, thus L&G has not formed a downtrend yet.

Meanwhile, as indicated by B, as price pulled back, volume also declined significantly. This suggests that the selling pressure was not huge, and technically, it is a healthy correction. Even thought chart wise it shows that there were no panic selling, investors or trader should not buy during a correction.

If price should rebound from the 14, 21, 31 EMA, it would form another Higher-low, and there is a good chance for price to re-test the RM0.515 level. If price should break above the RM0.515 level again with strong volume, it would suggests a resume of the uptrend, thus a buy signal. Then, the 14, 21, 31 EMA shall continue serving as the dynamic support as well as the Trailing Stop reference. On the contrary, if price should break below the 14, 21, 31 EMA, it would means an uptrend has failed, thus a signal to cut loss or to take profit. Next resistance is at RM0.56 and RM0.64 while the support is found at RM0.46.

4 Q Rolling PER

11.11 times

Dividend Yield

0%

Dividend

Dividend Yield

Net Profit Ratio

31/3/2009

0 sen

0%

40.34%

31/3/2008

0 sen

0%

23.02%

31/3/2007

0 sen

0%

7.78%

31/3/2006

0 sen

0%

24.39%

31/3/2005

0 sen

0%

-79.53%

Table 2: L&G-3174, yearly dividend, dividend yield, and net profit ratio.

Review of the previous Case Study: OSK-5053: Uptrend consolidation.


Chart 3: OSK-5053 (15/12/2009~14/04/2010)

As shown on chart 3, price of OSK tested the RM 1.46 resistance line and retraced, but it managed to rebound from the 14, 21, 31 EMA, suggesting that the uptrend remains intact. The immediate resistance for OSK is seen at RM1.46 level. (Refer to Arrow A)

Meanwhile, as indicated by B, when price rebounded from the 14, 21, 31 EMA and re-test the RM1.46 level, volume increased, suggesting some increased of buying interest. Technically, when price should break any resistance line, a strong volume is needed.

Nevertheless, if price should break above the RM1.46 level, then the 14, 21, 31 EMA shall resumes its role as a dynamic support as well as the trailing stop reference. In other words, provided that price is supported by the rising 14, 21, 31 EMA, investors should hold, until when price break below the 14, 21, 31 EMA it would a signal to take profit or to cut loss.

4 Q Rolling PER

8.18 times

Dividend Yield

5.28%

Dividend

Dividend Yield

Net Profit Ratio

31/12/2009

7.5 sen

6.1%

13.73%

31/12/2008

7.5 sen

7.58%

16.59%

31/12/2007

20 sen

8.62%

21.38%

31/12/2006

12.5 sen

6.38%

23.84%

31/12/2005

7.5 sen

7.85%

13.52%

Table 3: OSK-5053, yearly dividend, dividend yield, and net profit ratio.

Conclusion:
It is normal to have a correction during an uptrend, and especially a correction with low volume. However, it is not the best time to buy during a correction, and investors has to be cautious and discipline, to buy only when price rebound from the dynamic support.


Copyright © 2009 Straits Index (M) Sdn BhdImportant Disclaimer:These content provided by Straits Index (M) Sdn Bhd is solely for education and information purposes only, and do not suggest any investment advices. All information displayed are believed to be accurate and reliable. Interpretation of the data or analysis is at the reader's own risk. Straits Index (M) Sdn Bhd reserves the rights but obligations to update, admen, or even terminate the materials. 重要声明:以上的内容由海峡指数(马)私人有限公司提供,纯粹是教育性质, 并不是任何的投资忠告。所有资料显示认为是准确和可靠的。对数据或分析的解释和用途是在于用户自己的风险。海峡指数(马)有限公司持有保留及义务更新,甚 至终止材料的权利。

[Gamuda] [Ranhill] [Muhibah]

As the KLCI technical outlook remains positive, many counters are also forming uptrend. We shall continue study some counters case studies with positive signals, as well as a revision of previous case studies.

Gamuda: Breaking Resistance.

Chart 1: Gamuda (14/10/2009~07/04/2010)

Since breaking above the 14, 21, 31 EMA on the 23rdof March, price of Gamuda has been rising gradually, while the 14, 21, 31 EMA continue serving as the dynamic support. This suggests that the technical outlook for Gamuda is positive. As indicated by A, price of Gamuda broke above the RM2.94 level.

Technically, RM2.94 is the immediate support and in order to sustain this uptrend, price has to stay above the RM2.94 or the 14, 21, 31 EMA. And for traders who are holding Gamuda's share, it is a good idea to hold as long as the dynamic support remains intact. If price should break below the 14, 21, 31 EMA, it would be a signal to take profit or to cut loss.

As for traders who are looking to buy, an ideal entry position would be a rebound near the dynamic support, and preferably with strong volume, and after buying, the 14, 21, 31 EMA shall be applied as the trailing stop reference. Next resistance for Gamuda is at RM3.05 level followed by RM3.35.

4 Q Rolling PER

26.89 times

Dividend Yield

2.71%

Dividend

Dividend Yield

Net Profit Ratio

31/03/2009

8 sen

2.38%

7.10%

31/03/2008

25 sen

9.26%

13.52%

31/03/2007

46 sen

5.90%

12.23%

31/03/2006

16sen

4.57%

13.72%

31/03/2005

16sen

3.43%

17.26%

Table 1: Gamuda, yearly dividend, dividend yield, and net profit ratio.

Ranhill: Forming a Higher-Low.

Chart 2: Ranhill (08/12/2009~07/04/2010)

As shown on chart 2, after rebounding from RM0.74 level, price of Ranhill managed to break above the 14, 21, 31 EMA, and later formed a Higher-low above the 14, 21, 31 EMA. As indicated by A, price of Ranhill breaks above the RM0.82 resistance level with strong volume, but later retreated due to profit taking. However, as indicated by B, as price retreated, volume decreased significantly, suggesting that the selling pressure was mild.

Technically, if price should remains supported by the 14, 21, 31 EMA, the uptrend is still intact, and the most ideal uptrend would be another rebound above the 14, 21, 31 EMA with strong volume. For the mean time, traders should apply the 14, 21, 31 EMA as the trailing stop reference, and provided that price is still supported by the rising 14, 21, 31 EMA, it is fine to hold. If price should break below the 14, 21, 31 EMA, it would be a signal to take profit or to cut loss. Next resistance for Ranhill is seen at RM0.90 level.

4 Q Rolling PER

2.03 times

Dividend Yield

1.20%

Dividend

Dividend Yield

Net Profit Ratio

30/06.2009

1 sen

1.1%

10.29%

30/06.2008

0sen

0%

-36.75%

30/06.2007

0sen

0%

7.92%

30/06.2006

1.5sen

1.16%

-0.89%

30/06.2005

1.5sen

1.19%

2.22%

Table 2: Ranhill, yearly dividend, dividend yield, and net profit ratio.

Revision of last week's case study: Muhibah.

Chart 3: Muhibah (1/12/2009~31/03/2010)

As shown on chart 3, price of Muhibah consolidated above the 14, 21, 31 EMA for about 1 week. As indicated by A, it broke above the RM1.07 with strong volume as indicated by B, suggesting some strong buying interest to off set the profit taking selling pressure.

Technically, it is now moving in uptrend with the 14, 21, 31 EMA serving as the dynamic support. In other words, provided that the price is still supported by the 14, 21, 31 EMA, the uptrend shall remain intact, and if price should break below the 14, 21, 31 EMA, it would be a signal to cut loss, or to take profit.

Next resistance for Muhibah is seen at RM 1.17 level, while the support are at RM1.07 followed by the RM1.00 psychological level.

4 Q Rolling PER

27.87 times

Dividend Yield

2.45%

Dividend

Dividend Yield

Net Profit Ratio

31/12/2009

2.5 sen

2.72%

0.64%

31/12/2008

2.5 sen

2.53%

1.02%

31/12/2007

4.5 sen

1.20%

4.94%

31/12/2006

7.5 sen

2.88%

3.06%

31/12/2005

4 sen

5.76%

2.68%

Chart 3: Muhibah, yearly dividend, dividend yield, and net profit ratio.

Conclusion:
In a healthy uptrend, price should have a consolidation or a mild correction after each rally. While during correction or consolidation, volume should not be too high, therefore, to imply that the selling pressure or profit taking is not too strong. Therefore, when price rebound from the 14, 21, 31 EMA again, there is a better chance for the uptrend to resume; and when the price should rally again, the best confirmation would be a strong volume. In short, an experienced trader should not worry about taking profit too quickly, provided that the uptrend is supported with the above mentioned criteria.


Copyright © 2009 Straits Index (M) Sdn BhdImportant Disclaimer:These content provided by Straits Index (M) Sdn Bhd is solely for education and information purposes only, and do not suggest any investment advices. All information displayed are believed to be accurate and reliable. Interpretation of the data or analysis is at the reader's own risk. Straits Index (M) Sdn Bhd reserves the rights but obligations to update, admen, or even terminate the materials. 重要声明:以上的内容由海峡指数(马)私人有限公司提供,纯粹是教育性质, 并不是任何的投资忠告。所有资料显示认为是准确和可靠的。对数据或分析的解释和用途是在于用户自己的风险。海峡指数(马)有限公司持有保留及义务更新,甚 至终止材料的权利。

Case Studies [Scomi] [LG] [EO]

Generally, there are three types of uptrend, one that is a sharp rally of price without any consolidation nor correction, but this type of uptrend is usually short-lived, and hard to capture, and also risky. The other type of uptrend is the type with low gradient or slow rising pace, and this type of uptrend takes longer to form and usually last longer. The last type of uptrend is the most ideal type of uptrend, with rallies and correction, forming higher-lows and followed by breaking previous resistance (new highs), which associated with strong volume. This week, let us continue looking for some uptrend characteristics by studying some case studies together with a revision of last week's E&O, to see if it has already formed an uptrend.

Scomi: Strong technical rebound, could form an uptrend

Chart 1: Scomi (01/12/2009~31/03/2010)

As shown on the chart above, price of Scomi rebounded after finding its support at RM0.38, and later broke above the 14, 21, 31 EMA as indicated by A, with strong volume as indicated by B. This suggests that its has broken away from its downtrend and it could form an uptrend.

Ideally, the best uptrend would be a one with a formation of a higher-low. Therefore, if price should retreat and form a higher-low above the 14, 21, 21 EMA, it would be a characteristic of an ideal uptrend. But during a correction, volume should be relatively lower, for this would mean that the selling pressure is not too strong.

Technically, if price should form an higher-low and rebound from the 14, 21, 31 EMA, it would be a buy signal and best confirmed with strong volume. After buying, the 14, 21, 31 EMA would serve as the dynamic support as well as the trailing stop reference.

Leading PER

46.35 times

Dividend Yield

0.56%

Dividend

Dividend Yield

Net Profit Ratio

31/12/2009

0 sen

0%

0.5%

31/12/2009

0.5 sen

1.49%

5.53%

31/12/2008

1.25sen

1.10%

3.58%

31/12/2007

1.50 sen

1.49%

5.37%

31/12/2006

1.2 sen

1.20%

16.19%

Table 1: Scomi, yearly dividend, dividend yield, and net profit ratio.

L&G: Testing resistance.


Chart 2: L&G (01/12/2009~31/03/2010)

As shown on chart 2, price of L&G formed an Ascending Triangle, with L1 line being the dynamic support while the L2 (RM0.515) being the immediate resistance line. An Ascending Triangle implies some bullish biased for the price has already formed a higher-low but the upside room is still capped by the resistance line, thus limiting the upside movement.

As indicated by A, price of L&G breaks above the RM0.515 by margin, with increased of volume. This suggests that some inflow of fresh capital to off set the selling pressure. If price should stay above the RM0.515, it would be a valid bullish break out above the Ascending Triangle, thus a buy signal.

Meanwhile, the 14, 21, 31 EMA and the L1 line shall continue serving as the dynamic support as well as the trailing stop reference. Technically, provided that price should stay above these dynamic support, the uptrend shall remain intact. If price should break below the dynamic support, it would be a signal to take profit or to cut loss. Next resistance is seen at RM0.64 level while the support is at RM0.48.

Leading PER

11.11 times

Dividend Yield

0%

Dividend

Dividend Yield

Net Profit Ratio

31/03/2009

0 sen

0%

40.34%

31/03/2008

0 sen

0%

23.02%

31/03/2007

0 sen

0%

7.78%

31/03/2006

0 sen

0%

24.39%

31/03/2005

0 sen

0%

-79.53%

Table 2: L&G, yearly dividend, dividend yield, and net profit ratio.

Revision of last week's Case Studies: E&O

Chart 3: E&O (5/1/2010~31/03/2010)

As shown on chart 3, price of E&O formed an Ascending Triangle, with price forming a higher-low above the 14, 21, 31 EMA and later, breaking above the RM 1.04 resistance line. As indicated by A, after breaking RM1.04, price retreated due to profit taking, but it managed to stay above the RM 1.04 level.

Technically, the 14, 21, 31 EMA is still serving as the dynamic support as well as the trailing reference. If price should stay above the 14, 21, 31 EMA, the uptrend shall remains intact, and if price should break below the 14, 21, 31 EMA, it would be a signal to cut loss of the take profit.

Leading PER

31.72 times

Dividend Yield

0%

Dividend

Dividend Yield

Net Profit Ratio

31/03/2009

0 sen

0%

-12.45%

31/03/2008

5 sen

2.78%

24.95%

31/03/2007

4 sen

1.84%

5.76%

31/03/2006

0 sen

0%

12.93%

31/03/2005

0 sen

0%

9.3%

Table 3: E&O yearly dividend, dividend yield, and net profit ratio.

Conclusion:
In conclusion, an uptrend started with a technical rebound, and followed by a formation of a higher-low, with the confirmation of strong volume. However, a trader has to be very disciplined not to buy too early, and have to wait until price starts moving.


Copyright © 2009 Straits Index (M) Sdn BhdImportant Disclaimer:These content provided by Straits Index (M) Sdn Bhd is solely for education and information purposes only, and do not suggest any investment advices. All information displayed are believed to be accurate and reliable. Interpretation of the data or analysis is at the reader's own risk. Straits Index (M) Sdn Bhd reserves the rights but obligations to update, admen, or even terminate the materials. 重要声明:以上的内容由海峡指数(马)私人有限公司提供,纯粹是教育性质, 并不是任何的投资忠告。所有资料显示认为是准确和可靠的。对数据或分析的解释和用途是在于用户自己的风险。海峡指数(马)有限公司持有保留及义务更新,甚 至终止材料的权利。

Case Studies [TA] [Muhibah] [Axiata].

Total market volume breaks above the 40-day VMA level, suggesting that the overall market is well-participated. Generally, when volume remain above the 40-day VMA level, it implies that the market sentiment is likely to remain positive. This week, let us review some case studies of last week, and see if the technical rebound has now turning to an uptrend.

TA: Still waiting for form a higher-low. No uptrend yet.


Chart 1:TA (2/12/2009~31/03/2010)

As shown on chart 1, price of TA rebounded from the RM0.66 support, but until now, it has not formed an uptrend. As indicated by A, it tested the RM0.705 resistance and retreated as investors took profit. Fortunately, it stopped at the 14, 21, 31 EMA, suggesting that it might be forming a higher-low at the 14, 21, 31 EMA. If price should rebound from the 14, 21, 31 EMA, there is a good chance that it would form a higher-low, which is the first characteristic of an uptrend, and the most ideal formation would be one with strong volume.

Technical, if price should also break above the RM0.705 after forming a higher-low, it would be forming an uptrend, and the 14, 21, 31 EMA shall serve as the dynamic support as well as the trailing stop reference. On the other, hand, if price should break below the 14, 21, 31 EMA, and later breaking below the RM0.66 support, it would be making a new low, thus there is a risk of resuming its previous downtrend; therefore, it is a signal to cut loss.

4 Q Rolling PER

12.62 times

Dividend Yield

0%

Dividend

Dividend Yield

Net Profit Ratio

31/01/2010

0 sen

0%

20.89%

31/01/2009

4.50 sen

7.32%

16.94%

31/01/2008

10 sen

7.94%

41.33%

31/01/2007

7 sen

7.95%

36.94%

31/01/2006

3 sen

6.34%

25.54%

Table 1: TA, yearly dividend, dividend yield, and net profit ratio.

Muhibah: No Uptrend Yet:


Chart 2: Muhibah (1/12/2009~31/03/2010)

As indicated by A, price of Muhibah consolidated around the MR1.01 to RM1.03 level after rebounded strongly. As indicated by B, as price consolidated, volume declined, suggesting that currently, there are no panic selling, which generally means a healthy consolidation.

If price should remain above the 14, 21, 31 EMA, and rebound again, it would be forming a higher-low, which is the first technical condition for an uptrend, and it would be the most ideal condition if it should be accompanied by strong volume

Technically, Muhibah has not formed an uptrend yet, and even though there are chances that the above mentioned conditions could happen, investors has to be disciplined, and only started buying when price starts moving, because, if price should start falling and breaking below the 14, 21, 31 EMA and the RM0.91 level, it would be a new low, thus a risk of forming a new downtrend.

4 Q Rolling PER

25.68 times

Dividend Yield

2.66%

Dividend

Dividend Yield

Net Profit Ratio

31/12/2009

2.5 sen

2.72%

0.64%

31/12/2009

2.5 sen

2.53%

1.02%

31/12/2009

4.5 sen

1.20%

4.94%

31/12/2009

7.5 sen

2.88%

3.06%

31/12/2009

4 sen

5.76%

2.68%

Table 2: Muhibah, yearly dividend, dividend yield, and net profit ratio.

Axiata: Conslidating.

Chart 3: Axiata (1/12/2009~31/03/2010)

As shown on the chart above, price of Axiata retreated after testing the RM0.405 level, and until now, it has been consolidating in a narrow range. When price should consolidate at a narrow range, it would be the most ideal condition to apply the Bollinger Bands, as the Bollinger Bands will contract, and show an obvious signal. When the Bollinger Bands contracts, other than showing a consolidation signal, it also implies that price is actually preparing for a new movement, and the direction of the new movement shall be revealed once the Bollinger Bands re-expands.

Based on the characteristic of the Bollinger Bands, the narrower the band width gets, the re-expansion signal will be more significant, and it is usually easier to spot for the signal. If the Bollinger Bands should re-expand with price of Axiata above the Bollinger Middle Band, it would be a bullish signal, and with the confirmation of strong volume, the bullish signal is expected to be valid; and then, the Bollinger Middle Band shall serve as the dynamic support as well as the trailing stop reference.

On the other hand, if price should stay below the Bollinger Middle Band as the Bollinger Bands re-expand, it would be a bearish signal, and it would be a signal to take profit or the cut loss, and for bearish signal, you do not need any increase of volume to confirm the signal.

4 Q Rolling PER

17.50 times

Dividend Yield

0%

Dividend

Dividend Yield

Net Profit Ratio

31/12/2009

0 sen

0%

12.61%

31/12/2008

0 sen

0%

4.39%

Table 3: Axiata, yearly dividend, dividend yield, and net profit ratio.

Conclusion:

All healthy uptrend started with a technical rebound, and gradually turning into an uptrend, and it requires time to form an uptrend, as well as volume in breaking resistance as well as the rebound from the dynamic support. Other wise, there is a chance of a 'false breakout'.


Copyright © 2009 Straits Index (M) Sdn BhdImportant Disclaimer:These content provided by Straits Index (M) Sdn Bhd is solely for education and information purposes only, and do not suggest any investment advices. All information displayed are believed to be accurate and reliable. Interpretation of the data or analysis is at the reader's own risk. Straits Index (M) Sdn Bhd reserves the rights but obligations to update, admen, or even terminate the materials. 重要声明:以上的内容由海峡指数(马)私人有限公司提供,纯粹是教育性质, 并不是任何的投资忠告。所有资料显示认为是准确和可靠的。对数据或分析的解释和用途是在于用户自己的风险。海峡指数(马)有限公司持有保留及义务更新,甚 至终止材料的权利。

Case Studies [Lionind] [EO] [OSK].

The KLCI managed to rebound from the 1292 WinChart Automatic Fibonacci Retracement (38.2% retracement), gaining about 40 points, let us study a few case studies for this week.

Lionind: Waiting for breakout Resistance of Ascending Triangle:

Chart 1: Lionind (01/12/2009~31/03/2010)

Price of Lionind formed an Ascending Triangle, with the T1line being the dynamic support, and the resistance is at RM 1.85 level. An Ascending Triangle it self is an short-mid term uptrend biased consolidation but with limited upside room due to the resistance. And the characteristic of an Ascending Triangle is that the fluctuation of price will get narrower and narrower as it moves towards the tip of the triangle.

Technically, whenever price rebound from T1 line, it is forming a Higher-low, suggesting that the uptrend is still intact, but price would still need to break above the RM1.85 resistance in order to make room for a healthy uptrend.

If price should rebound form the T1 line and also break above RM1.85 resistance, it would be an end to the consolidation, and a good chance for the uptrend to continue. However, this has to be confirmed with strong volume at the break out, or it could be a “false breakout”. Nevertheless, if investors or trader were to apply the 14, 21, 31 EMA as a trailing stop method, the trading risk is still minimal. Provided that price of Lionind is still supported by the 14, 21, 31 EMA, the uptrend remains intact, and if price should break below the 14, 21, 31 EMA, it would be a signal to take profit or to cut loss.

Leading PER

4.16 times

Dividend Yield

0.56%

Dividend

Dividend Yield

Net Profit Ratio

30/06/2009

1 sen

0.8%

-6.06%

30/06/2008

1 sen

0.38%

12.43%

30/06/2007

1 sen

0.57%

4.36%

30/06/2006

0.5 sen

0.52%

-0.29%

30/06/2005

1 sen

0.81%

8.26%

Table 1: Lionind, yearly dividend, dividend yield, and net profit ratio.

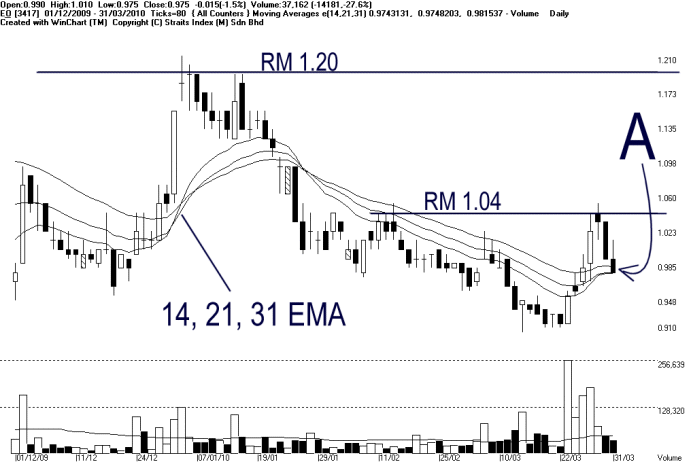
E&O: Waiting for form a higher-low:

Chart 2: E&O (01/12/2009~31/03/2010)

As shown on chart 2, price of E&O rebounded from the RM0.91 level, and breaking above the 14, 21, 31 EMA. However, it hits a resistance at RM1.04 level, as profit taking took place. As indicated by A, price retreated after hitting the resistance at RM1.04 but now testing the 14, 21, 31 EMA.

If price should rebound from th 14, 21, 31 EMA, there is a good chance that it would form a Higher-low, which is the first technically criteria of an uptrend. However, when price form a higher-lower, a strong volume is needed, and it would be an ideal condition. After forming an higher-lower, the immediate target would be RM1.04 level, and it would require strong volume again to break above the RM1.04 resistance.

Technically, when it forms a Higher-low, it would be a first buy signal, with the 14, 21, 31 EMA being the dynamic support as well as a trailing stop, and provided that price could stay above the 14, 21, 31 EMA, there is a chance of an uptrend formation, and until price should break below the 14, 21, 31 EMA, then, it would be a signal to take profit or to cut loss.

Leading PER

29.35 times

Dividend Yield

0%

Dividend

Dividend Yield

Net Profit Ratio

31/3/2009

0 sen

0%

-12.45%

31/3/2008

5 sen

2.78%

24.95%

31/3/2007

4 sen

1.84%

5.76%

31/3/2006

0 sen

0%

12.93%

31/3/2005

0 sen

0%

9.3%

Table 2: E&O, yearly dividend, dividend yield, and net profit ratio.

OSK: Uptrend intact:

Chart 3: OSK (5/1/2010~31/03/2010)

As indicated on Chart 3, price of OSK formed the T1 uptrend, while the 14, 21, 31 EMA is still supporting the uptrend and serving as the dynamic support. As indicated by A, price consolidated after rebound from the T1 line, and this is a very typical behavior of a healthy uptrend. Provided that the price should remain supported by the T1 or the 14, 21, 31 EMA, the uptrend remains intact.

Immediate resistance for OSK is at RM1.40 level, and the next resistance is seen at RM1.46. Technically, volume has to increase in order to support the break out, while the 14, 21, 31 EMA serves as the trailing reference.

4 Q Rolling PER

7.95 times

Dividend Yield

8.81%

Dividend

Dividend Yield

Net Profit Ratio

31/12/2009

7.5 sen

6.1%

13.73%

31/12/2008

7.5 sen

7.58%

16.59%

31/12/2007

20 sen

8.62%

21.38%

31/12/2006

12.5 sen

6.38%

23.84%

31/12/2005

7.5 sen

7.85%

13.52%

Table 3: OSK, yearly dividend, dividend yield, and net profit ratio.

Conclusion:
When the broad market is trending up, many individual counters would be forming uptrend as well, but investors should never carelessly picking any stock. It is important to know that a healthy uptrend should have higher-lows and breaking new highs, together with the confirmation of volume, or else, they could be giving false break out signal.


Copyright © 2009 Straits Index (M) Sdn BhdImportant Disclaimer:These content provided by Straits Index (M) Sdn Bhd is solely for education and information purposes only, and do not suggest any investment advices. All information displayed are believed to be accurate and reliable. Interpretation of the data or analysis is at the reader's own risk. Straits Index (M) Sdn Bhd reserves the rights but obligations to update, admen, or even terminate the materials. 重要声明:以上的内容由海峡指数(马)私人有限公司提供,纯粹是教育性质, 并不是任何的投资忠告。所有资料显示认为是准确和可靠的。对数据或分析的解释和用途是在于用户自己的风险。海峡指数(马)有限公司持有保留及义务更新,甚 至终止材料的权利。

Wednesday, April 7, 2010

Case Studies [TA] [Muhibah] [Uemland].

All uptrend started with a technical rebound and followed by a higher-low, and confirm with an increased of volume, these are the most ideal criteria of a healthy uptrend. Other than finding a right stock, finding an ideal entry point is crucial. Let's take a look at some case studies.

TA: Technical Rebound.

Chart 1: TA, from 2/10/2009 to 25/03/2010.

As indicated by chart 1, price of TA rebound from the RM0.66 support, after consolidating above the RM0.66 level for more than a month. As indicated by A, price of TA rebounded again and this time, with volume increasing, as indicated by B. First target of the rebound is at RM0.70, and the increased of volume suggests some increased of inflow of fresh capital to off set some selling pressure.

If price should also break above the RM0.70 level, with volume remains strong, the 14, 21, 31 EMA would, by then, by serving as the dynamic support, as well as the trailing stop reference, and the next resistance is at RM0.78 level. Technically, provided that price is still supported by the 14, 21, 31 EMA, the uptrend remains intact, and it would be a good idea to hold on to the stocks until price should break below the 14, 21, 31 EMA.

On the other hand, if price should failed to break above the RM0.70 level, and started retreat again, and once it should break below RM0.66, it would be making a new low, suggesting that it could be forming a downtrend again, thus a signal to cut loss.

4 Q Rolling PER

12.62 times

Dividend Yield

0%

Dividend

Dividend Yield

Net Profit Ratio

31/01/2010

0 sen

0%

20.89%

31/01/2009

4.50 sen

7.32%

16.94%

31/01/2008

10 sen

7.94%

41.33%

31/01/2007

7 sen

7.95%

36.94%

31/01/2006

3 sen

6.34%

25.54%

Table 1: TA, yearly dividend, dividend yield, and net profit ratio.

Muhibah: Technical rebound.


Chart 2: Muhibah, from 23/11/2009 to 24/03/2010.

As shown on chart 2, price of Muhibah rebounded from the RM0.91 support after consolidating above the RM0.91 level for quite some time. As indicated by A, price of Muhibah is testing the 14, 21, 31 EMA again.

With volume gradually increasing, it suggests that the buying interest is getting stronger, despite the rebound is not obvious yet. Therefore, if price should start rally, we shall monitor if it should form a higher-low, which is the characteristic of an ideal uptrend. Generally, if price should break above the 14, 21, 31 EMA, the 14, 21, 31 EMA would be serving as the dynamic support as well as the trailing stop reference. Then, the next resistance are found at RM1.09 followed by the RM1.20 WinChart Automatic Fibonacci Retracement.

In contrary, if price should failed to break above the 14, 21, 31 EMA, but instead, breaking below the RM0.91 level, it would be making a new low, thus suggesting the downtrend would resume, and it would be a signal to cut loss for the next support are found at RM0.77 followed by RM0.645.

4 Q Rolling PER

25.68 times

Dividend Yield

2.66%

Dividend

Dividend Yield

Net Profit Ratio

31/12/2009

2.5 sen

2.72%

0.64%

31/12/2008

2.5 sen

2.53%

1.02%

31/12/2007

4.5 sen

1.20%

4.94%

31/12/2006

7.5 sen

2.88%

3.06%

31/12/2005

4 sen

5.76%

2.68%

Table 2: Muhibah yearly dividend, dividend yield, and net profit ratio.

Uemland UEM: Positive biased movement.

Chart 3: Uemland, from 23/11/2009 to 24/03/2010.

As shown on chart 3, price of UEMland formed a Symmetrical Triangle with L1 being the dynamic resistance line and the L2 being the dynamic support line. As price consolidates within the Symmetrical Triangle, the fluctuation of price is gradually reducing, which is the characteristic of a Triangle. Meanwhile, other than showing a consolidation signal, the Triangle also imply a break out timing, it is when price is near the tip of the Triangle.

As indicated by A, price of UEMLand is now testing the L1 dynamic resistance line, and if price should break above this line, with substantial volume, it would be a bullish break, then the 14, 21, 31 EMA shall serve as the dynamic support as well as the Trailing Stop reference.

On the other hand, if price should retreated after testing the L1 line, and later breaking below the L2 line, it would be a bearish break out, thus a signal suggesting to cut loss. Other than the L1 and L2 line, support for UEMLand is at RM1.38 while the resistance is at RM 1.50.

4 Q Rolling PER

31.14 times

Dividend Yield

0%

Dividend

Dividend Yield

Net Profit Ratio

31/12/2009

0 sen

0%

28.44%

31/12/2008

0 sen

0%

14.50%

Table 3: Uemland, yearly dividend, dividend yield, and net profit ratio.

Conclusion:
Technically, all uptrend started with a technical rebound, but a wise trader should know that a technical rebound is only a very beginning, thus an uptrend is not yet forming. Therefore, after a rebound, the next feature we should look for is the forming of a higher-low, and confirm with volume, and most of all, with a sound trading plan. This is what makes a professional trader difference from an average trader.


Copyright © 2009 Straits Index (M) Sdn BhdImportant Disclaimer:These content provided by Straits Index (M) Sdn Bhd is solely for education and information purposes only, and do not suggest any investment advices. All information displayed are believed to be accurate and reliable. Interpretation of the data or analysis is at the reader's own risk. Straits Index (M) Sdn Bhd reserves the rights but obligations to update, admen, or even terminate the materials. 重要声明:以上的内容由海峡指数(马)私人有限公司提供,纯粹是教育性质, 并不是任何的投资忠告。所有资料显示认为是准确和可靠的。对数据或分析的解释和用途是在于用户自己的风险。海峡指数(马)有限公司持有保留及义务更新,甚 至终止材料的权利。