Chart 1: KLCI chart from 14/09/2009 to 16/12/2009.
As indicated by A, the KLCI breaks above the L1 descending line on the 15th of December, lead by heavy weighted blue chips, and therefore, showing some signs that the downtrend of the KLCI might not be forming immediately. However, as indicated by B, total market volume did not increase significantly. Technically, an ideal break out above any resistance should accompanied by substantial volume, and a break out with thin volume is likely to be a false one.
Important criteria for an uptrend:
Chart 2: KLCI with the 40-day VMA level.
As indicated by A and B, when the KLCI is moving in a healthy uptrend, total market volume has to break above the 40-day VMA level, in order to fuel the market rally with sufficient inflow of capital. This is the ideal uptrend criteria.
When volume above the 40-day VMA level, it suggests that the overall market is actively participated, thus the market is well liquid as well as the buying interest is strong enough to absorb selling pressure. Rally with thin volume is less likely to sustain.
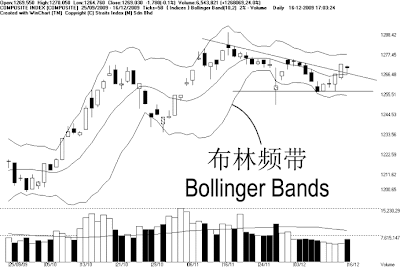
Chart 3: KLCI with Bollinger Bands
Since market volume is generally low, and the market is lack of fresh leads. The KLCI is still fluctuating in narrow range, while not forming any prominent trend. If the KLCI should continue to trade within 1258 and 1274, investors should apply the Bollinger Bands to monitor the next move of the KLCI.
When the Bollinger Bands should re-expands, it would be a signal suggesting a beginning of a new movement after consolidation. If the KLCI should stay above the Bollinger Middle Band, it would be a bullish biased signal, but the best confirmation is that volume above the 40-day VMA level. On the other hand, if the KLCI should stay below the Bollinger Middle Band as the Bollinger Bands expands, it would be a bearish signal.
This week's Case Studies:
Chart 4: RHBCap, from 20/08/2009 to 16/12/2009.
After price of RHBCap reaching RM5.74 high on the 16thof October, it started a technical correction, but soon it found its support around RM5.20~RM5.25 level, and price rebounded. However, despite finding a support, price of RHBCap has never returned to RM5.74 level, and therefore, forming a L1 and L2 Descending Triangle,which suggest a consolidation as the price fluctuating within the Descending Triangle is getting narrower.
As indicated by A, price of RHBcap is now at the very end of the Descending Triangle, which implies that a break out is inevitable. However, due to the prolong consolidation of the KLCI, there is also a chance that RBHCap might just continue its sideways movement without forming a prominent trend. Therefore, it is best to combine the Bollinger Bands signal when price of RHBCap breaks out from the Descending Triangle.
If price should break above the L1 line, with the Bollinger Bands expanding, then it would be a bullish signal, if investors should buy with this signal, the L1 line will be a cut-loss point if price should retreat.
Of course, the most ideal signal is a valid break out above the L1 line, with the Bollinger Bands expanding while price of RHBcap stays above the Bollinger Middle Band, coupled with the increased of volume, and the Bollinger Middle Band shall serve as the dynamic support as well as the trailing stop reference.
| Rolling 4 Q PE | 10.81 times | Dividend Yield | 3.68% |
| Dividend | Dividend Yield | Net Profit Ratio | |
| 31/12/2008 | 19.6 sen | 17.48% | 5.24% |
| 31/12/2007 | 13.6 sen | 11.58% | 2.62% |
| 31/12/2006 | 8 sen | 7.96% | 2.25% |
| 31/12/2005 | 3.5 sen | 8.63% | 1.61% |
| 31/12/2004 | 10 sen | 14.22% | 4.27% |
Table 1: RHBCap Yearly Dividend yield, dividend and Net profit ratio.
Chart 5: Maxis, chart from 19/11/2009 to 16/12/2009.
Since the re-listing of Maxis in November, price of Maxis has been trading at a narrow range, thus the Bollinger Bands is contracting, suggesting that the price of Maxis is in deed consolidating while preparing for a new movement. When the Bollinger Bands should re-expand, it would be a signal suggesting a beginning of a new movement, and if price of Maxis should stay above the Bollinger Middle Band, it would be a bullish signal, and the immediate resistance is at RM 5.50. Otherwise, if price should stay below the Bollinger Middle Band, it would be a bearish signal for Maxis, and the next support is at RM 5.20.
| Leading PE | 17.24 times | Dividend Yield | 0% |
Table 2: Maxis PER and Dividend yield.
Conclusion:
In conclusion, the KLCI is currently extending its consolidation, and temporary avoiding its formation of a downtrend. Therefore, there is a chance that the KLCI bearish reversal formation might fail. Nevertheless, when the KLCI prolong its consolidation, the Bollinger Bands is usually more effective in detecting the next movement. When the Bollinger Bands should re-expanding, it would be a signal suggesting a beginning of the new movement.
Copyright © 2009 Straits Index (M) Sdn BhdImportant Disclaimer:These content provided by Straits Index (M) Sdn Bhd is solely for education and information purposes only, and do not suggest any investment advices. All information displayed are believed to be accurate and reliable. Interpretation of the data or analysis is at the reader's own risk. Straits Index (M) Sdn Bhd reserves the rights but obligations to update, admen, or even terminate the materials. 重要声明:以上的内容由海峡指数(马)私人有限公司提供,纯粹是教育性质, 并不是任何的投资忠告。所有资料显示认为是准确和可靠的。对数据或分析的解释和用途是在于用户自己的风险。海峡指数(马)有限公司持有保留及义务更新,甚 至终止材料的权利。


