IRCB – 2127: Possibly uptrend.
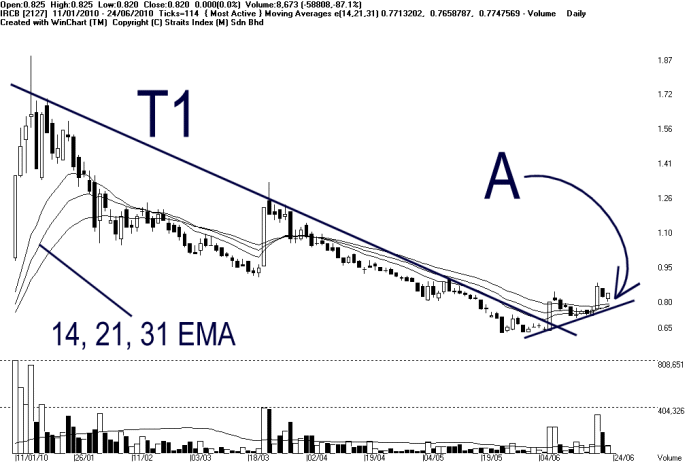
Chart 1: IRCB – 2127 (11/01/2010 ~ 23/06/2010 )
As shown on chart 1, IRCB rebounded at RM0.645 level, and broke above the downtrend line. It also broke above the 14, 21, 31 EMA, and later forming a higher-low, as indicated by A, this is a sign of an uptrend formation. If volume should remain strong, the uptrend is expected to carry on.
Technically, provided that the price is above 14, 21, 31 EMA, the uptrend would sustain, until the price should break below 14, 21, 31 EMA, then it would be a signal to take profit or to cut loss. Despite technical signal suggesting and uptrend, based on the behavior of this counter, it is highly speculative by nature. Therefore, investors are advised to follow strictly their trading plan. Current support is at RM0.73 while the resistance is at RM0.90.
| 4 Q Rolling PER | 37.1 times | Dividend Yield | 0% |
| Dividend | Dividend Yield | Net Profit Ratio | |
| 31/01/2010 | 0sen | 0% | 3.56% |
| 31/01/2009 | 0sen | 0% | -3.83% |
| 31/01/2008 | 0sen | 0% | -16.09% |
| 31/01/2007 | 0sen | 0% | -5.36% |
| 31/01/2006 | 0sen | 0% | 0.15% |
Table 1: IRCB – 2127, yearly dividend, dividend yield, and net profit ratio.
CSCSTEL – 5094: Could resume its uptrend.

Chart 2: CSCSTEL – 5094 (10/02/2010 ~ 23/06/2010)
As shown on chart 2, price of CSCSTEL retreated for the last two months as lead by the weakening broad market. However, as indicated by A, price of CSCSTEL rebounded quickly, and returned to above the 14, 21, 31 EMA, as soon as the broad market rebounded.
Technically, with price of CSCSTEL above the 14, 21, 31 EMA, the immediate technical outlook is on the positive side. If volume should pickup, it would test the RM2.00 level. For investors who are holding this stock, it is a good idea to hold on to the positions provided that price is still supported by the 14, 21, 31 EMA dynamic support, until price should break below the 14, 21, 31 EMA, it would be a signal to take profit or to cut loss.
| 4 Q Rolling PER | 6.11 times | Dividend Yiel d | 10.53% |
| Dividend | Dividend Yield | Net Profit Ratio | |
| 31/12/2009 | 20 sen | 13.07 % | 10.48 % |
| 31/12/2008 | 8.5 sen | 10.12 % | 4.28 % |
| 31/12/2007 | 12 sen | 8.11 % | 6.12 % |
| 31/12/2006 | 10 sen | 9.35 % | 6.97 % |
| 31/12/2005 | 0 sen | 0 % | 6.42 % |
Table 2: CSCSTEL – 5094, yearly dividend, dividend yield, and net profit ratio.
3A – 0012: Break out of downtrend.

Chart 3: 3A – 0012 (03/02/2010 ~ 23/06/2010)
As shown on chart 3, price of 3A break above the T1 downtrend after rebounded from the RM1.56 level. Not only that, price of 3A also broke above the 14, 21, 31 EMA and now forming an uptrend, with the 14, 21, 31 EMA serving as the dynamic support.
As indicated by A, price of 3A retreated slightly as a technical correction. If price should rebound from the 14, 21, 31 EMA or the T2 line, it would form a higher-low, thus a characteristic of an uptrend. If volume should increased significantly as it forms a higher-low, it would be a buy signal, and the uptrend is expected to carry on. On the other hand, if price should break below the T2 line or the 14, 21, 31 EMA, the uptrend would fail, thus a signal to take profit or the cut loss. Support for 3A is at RM1.75 while the resistance is at RM1.87 and RM 1.96.
| 4 Q Rolling PER | 27.34 times | Dividend Yield | 0 % |
| Dividend | Dividend Yield | Net Profit Ratio | |
| 31/12/2009 | 0 sen | 0% | 10.10% |
| 31/12/2008 | 0 sen | 0% | 7.97% |
| 31/12/2007 | 1.2 sen | 1.85 % | 11.36% |
| 31/12/2006 | 1.2 sen | 4.53 % | 5.39% |
| 31/12/2005 | 0 sen | 0% | 5.48% |
Table 3: 3A – 0012, yearly dividend, dividend yield, and net profit ratio.
Conclusion:
In short, other than price being able to stand above the dynamic support, the increase of volume in an uptrend is also important, for the increase of volume suggests the increase of fresh capital inflow to wash out selling pressure, thus the uptrend could sustain. Of course, a smart investor should be well equipped with the skills of analysis as well as the wisdom to follow the direction of the broad market.
Copyright © 2009 Straits Index (M) Sdn BhdImportant Disclaimer:These content provided by Straits Index (M) Sdn Bhd is solely for education and information purposes only, and do not suggest any investment advices. All information displayed are believed to be accurate and reliable. Interpretation of the data or analysis is at the reader's own risk. Straits Index (M) Sdn Bhd reserves the rights but obligations to update, admen, or even terminate the materials. 重要声明:以上的内容由海峡指数(马)私人有限公司提供,纯粹是教育性质, 并不是任何的投资忠告。所有资料显示认为是准确和可靠的。对数据或分析的解释和用途是在于用户自己的风险。海峡指数(马)有限公司持有保留及义务更新,甚 至终止材料的权利。