Wednesday, April 7, 2010

Case Studies [TA] [Muhibah] [Uemland].

All uptrend started with a technical rebound and followed by a higher-low, and confirm with an increased of volume, these are the most ideal criteria of a healthy uptrend. Other than finding a right stock, finding an ideal entry point is crucial. Let's take a look at some case studies.

TA: Technical Rebound.

Chart 1: TA, from 2/10/2009 to 25/03/2010.

As indicated by chart 1, price of TA rebound from the RM0.66 support, after consolidating above the RM0.66 level for more than a month. As indicated by A, price of TA rebounded again and this time, with volume increasing, as indicated by B. First target of the rebound is at RM0.70, and the increased of volume suggests some increased of inflow of fresh capital to off set some selling pressure.

If price should also break above the RM0.70 level, with volume remains strong, the 14, 21, 31 EMA would, by then, by serving as the dynamic support, as well as the trailing stop reference, and the next resistance is at RM0.78 level. Technically, provided that price is still supported by the 14, 21, 31 EMA, the uptrend remains intact, and it would be a good idea to hold on to the stocks until price should break below the 14, 21, 31 EMA.

On the other hand, if price should failed to break above the RM0.70 level, and started retreat again, and once it should break below RM0.66, it would be making a new low, suggesting that it could be forming a downtrend again, thus a signal to cut loss.

4 Q Rolling PER

12.62 times

Dividend Yield

0%

Dividend

Dividend Yield

Net Profit Ratio

31/01/2010

0 sen

0%

20.89%

31/01/2009

4.50 sen

7.32%

16.94%

31/01/2008

10 sen

7.94%

41.33%

31/01/2007

7 sen

7.95%

36.94%

31/01/2006

3 sen

6.34%

25.54%

Table 1: TA, yearly dividend, dividend yield, and net profit ratio.

Muhibah: Technical rebound.


Chart 2: Muhibah, from 23/11/2009 to 24/03/2010.

As shown on chart 2, price of Muhibah rebounded from the RM0.91 support after consolidating above the RM0.91 level for quite some time. As indicated by A, price of Muhibah is testing the 14, 21, 31 EMA again.

With volume gradually increasing, it suggests that the buying interest is getting stronger, despite the rebound is not obvious yet. Therefore, if price should start rally, we shall monitor if it should form a higher-low, which is the characteristic of an ideal uptrend. Generally, if price should break above the 14, 21, 31 EMA, the 14, 21, 31 EMA would be serving as the dynamic support as well as the trailing stop reference. Then, the next resistance are found at RM1.09 followed by the RM1.20 WinChart Automatic Fibonacci Retracement.

In contrary, if price should failed to break above the 14, 21, 31 EMA, but instead, breaking below the RM0.91 level, it would be making a new low, thus suggesting the downtrend would resume, and it would be a signal to cut loss for the next support are found at RM0.77 followed by RM0.645.

4 Q Rolling PER

25.68 times

Dividend Yield

2.66%

Dividend

Dividend Yield

Net Profit Ratio

31/12/2009

2.5 sen

2.72%

0.64%

31/12/2008

2.5 sen

2.53%

1.02%

31/12/2007

4.5 sen

1.20%

4.94%

31/12/2006

7.5 sen

2.88%

3.06%

31/12/2005

4 sen

5.76%

2.68%

Table 2: Muhibah yearly dividend, dividend yield, and net profit ratio.

Uemland UEM: Positive biased movement.

Chart 3: Uemland, from 23/11/2009 to 24/03/2010.

As shown on chart 3, price of UEMland formed a Symmetrical Triangle with L1 being the dynamic resistance line and the L2 being the dynamic support line. As price consolidates within the Symmetrical Triangle, the fluctuation of price is gradually reducing, which is the characteristic of a Triangle. Meanwhile, other than showing a consolidation signal, the Triangle also imply a break out timing, it is when price is near the tip of the Triangle.

As indicated by A, price of UEMLand is now testing the L1 dynamic resistance line, and if price should break above this line, with substantial volume, it would be a bullish break, then the 14, 21, 31 EMA shall serve as the dynamic support as well as the Trailing Stop reference.

On the other hand, if price should retreated after testing the L1 line, and later breaking below the L2 line, it would be a bearish break out, thus a signal suggesting to cut loss. Other than the L1 and L2 line, support for UEMLand is at RM1.38 while the resistance is at RM 1.50.

4 Q Rolling PER

31.14 times

Dividend Yield

0%

Dividend

Dividend Yield

Net Profit Ratio

31/12/2009

0 sen

0%

28.44%

31/12/2008

0 sen

0%

14.50%

Table 3: Uemland, yearly dividend, dividend yield, and net profit ratio.

Conclusion:
Technically, all uptrend started with a technical rebound, but a wise trader should know that a technical rebound is only a very beginning, thus an uptrend is not yet forming. Therefore, after a rebound, the next feature we should look for is the forming of a higher-low, and confirm with volume, and most of all, with a sound trading plan. This is what makes a professional trader difference from an average trader.


Copyright © 2009 Straits Index (M) Sdn BhdImportant Disclaimer:These content provided by Straits Index (M) Sdn Bhd is solely for education and information purposes only, and do not suggest any investment advices. All information displayed are believed to be accurate and reliable. Interpretation of the data or analysis is at the reader's own risk. Straits Index (M) Sdn Bhd reserves the rights but obligations to update, admen, or even terminate the materials. 重要声明:以上的内容由海峡指数(马)私人有限公司提供,纯粹是教育性质, 并不是任何的投资忠告。所有资料显示认为是准确和可靠的。对数据或分析的解释和用途是在于用户自己的风险。海峡指数(马)有限公司持有保留及义务更新,甚 至终止材料的权利。

Case Studies Triangles [Maybulk] [Gpacket] [Leader].

Chart Patterns analysis is the most important aspect of Technical Analysis, and we have Reversal Patterns and Consolidation Patterns. Last week, we mentioned Triangles, and this week, we shall take a look at some counters forming Triangles together with a revision of Leaders and it Ascending Triangle.

Maybulk: Symmetrical Triangle.

Chart 1: Maybulk, from 30/01/2009 to 24/03/2010.

As shown on chart 1, price of Maybulk formed a Symmetrical Triangle, with the T1 line being the dynamic resistance and the T2 line being the dynamic support. The formation of a Symmetrical Triangle suggests that price is now consolidating while preparing for a new trend, and the new trend shall only be revealed when price break out away from the Triangle. Another characteristic of Triangle is that the volatility of price is gradually reducing, while the Symmetrical Triangle suggests equal strength of the resistance and the support, thus giving no bias on either side.

As indicated by A, price of Maybulk is now moving towards the tip of the Symmetrical Triangle, which suggests that a break out is likely to take place in near term. If price should break above the T1 line, with substantial volume (as indicated by B), it would be a bullish break out, thus a buying signal, and the 14, 21, 31 EMA shall serve as the dynamic support as well as the trailing stop reference.

In contrary, if price should break below the T2 line after being resisted by the T1 line, it would be a bearish break out, suggesting that the price movement is likely to remain weak, thus a signal to take profit or the cut loss. Then, the 14, 21, 31 EMA would be serving as the dynamic resistance. Other than the T1 and T2 lines, resistance for Maybulk are found at RM3.24 and RM3.26level, while the supports are at RM 3.11 and RM3.00.

4 Q Rolling PER

12.8 times

Dividend Yield

4.81%

Dividend

Dividend Yield

Net Profit Ratio

31/12/2009

15 sen

4.87%

80.27%

31/12/2008

40 sen

16.74%

63.91%

31/12/2007

38 sen

8.52%

89.55%

31/12/2006

30 sen

11.72%

70.73%

31/12/2005

17 sen

8.10%

162.89%

Table 1: Maybulk, yearly dividend, dividend yield, and Net profit ratio.

Gpacket: Symmetrical Triangle

Chart 2: Gpacket, from 12/11/2009 to 24/03/2010.

As shown on chart 2, price of Gpacket formed a Symmetrical Triangle, with L1 line being the dynamic support and the L2 line being the dynamic resistance. As indicated by A, price of Gpacket has been trading within the boundary of the Symmetrical Triangle for long time, and now it is getting closer to the tip of the Triangle, which implies that a break out is due to take place.

If price should break above the L2 line, it would be a bullish break out, provided that the volume is significantly stronger, which would confirm such bullish signal. Then, the 14, 21, 31 EMA shall be serving as the dynamic support, and for those investors who are already holding this share, it would be a good idea to continue holding them until price should break below the 14, 21, 31 EMA. Next resistances for Gpacket are found at RM1.26 and RM 1.45.

On the other hand, if price should break below the L1 line, it would be a bearish break out, thus a signal suggesting to take profit or the cut loss, and the 14, 21, 31 EMA shall be serving as the dynamic resistance. Next supports for Gpacket are at RM1.10 and RM1.00.

4 Q Rolling PER

-2.93 times

Dividend Yield

0%

Dividend

Dividend Yield

Net Profit Ratio

31/12/2009

0 sen

0%

-75.17%

31/12/2008

0 sen

0%

-62.18%

31/12/2007

0 sen

0.44%

24.55%

31/12/2006

2 sen

0.98%

55.88%

31/12/2005

2 sen

0%

80.54%

Table 2: Gpacket, yearly dividend, dividend yield, and net profit ratio.

Leader: Break out above Ascending Triangle.

Chart 3: Leader, from 23/11/2009 to 24/03/2010.

Let's review last weeks's case study of Leader. Price of Leader has been consolidating within the Ascending Triangle for a long time, while the T1 line is still serving as the dynamic support for its mid term uptrend, but the upside room is limited unless a bullish break out above the RM0.93 ~ RM0.96 resistance. As indicated by A, price broke above the resistance line, with strong volume (as indicated by B), suggesting some increase of fresh capital inflow, to off set the selling pressure at the resistance level.

The 14, 21, 31 EMA shall continue serving as the dynamic support for Leader and provided that price should remains above the dynamic support, the uptrend remains intact. Immediate support is at RM0.93 ~ RM0.96 while the next resistance is at RM1.00.

4 Q Rolling PER

7.59 times

Dividend Yield

3.23%

Dividend

Dividend Yield

Net Profit Ratio

31/12/2009

3 sen

3.31%

2.74%

31/12/2008

3 sen

6.82%

2.56%

31/12/2007

3 sen

2.75%

2.34%

31/12/2006

1.5 sen

2.65%

1.49%

31/12/2005

0 sen

0%

1.37%

Table 3: Leader, yearly dividend, dividend yield, and net profit ratio.

Conclusion:
Quite often, price forms Triangle patterns, and other than showing a consolidating signal, triangles also imply a break out timing, in which a trained analyst would spot the precise timing.


Copyright © 2009 Straits Index (M) Sdn BhdImportant Disclaimer:These content provided by Straits Index (M) Sdn Bhd is solely for education and information purposes only, and do not suggest any investment advices. All information displayed are believed to be accurate and reliable. Interpretation of the data or analysis is at the reader's own risk. Straits Index (M) Sdn Bhd reserves the rights but obligations to update, admen, or even terminate the materials. 重要声明:以上的内容由海峡指数(马)私人有限公司提供,纯粹是教育性质, 并不是任何的投资忠告。所有资料显示认为是准确和可靠的。对数据或分析的解释和用途是在于用户自己的风险。海峡指数(马)有限公司持有保留及义务更新,甚 至终止材料的权利。

Case Studies: Pelikan, Keyasic, Kurasia.

It pays a high cost to be late in the market, and it usually also pays a high cost of entering too early in some cases. All uptrend started with a technical rebound, and therefore, it pays to study each rebound to see if it would later form an uptrend, with the uptrend characteristics.


Chart 1: Pelikan, chart from 7/10/2009 to 17/03/2010.

As indicated by A, price of Pelikan rebounded strongly after being supported by the RM 1.21 level, breaking above the 14, 21, 31 EMA. However, soon profit taking took place and price retreated after touching RM 1.38 level. At the moment, price is supported by the 14, 21, 31 EMA.

Technically, price has to rebound above the 14, 21, 31 EMA and form a Higher-low, in order to have the characteristic of an uptrend. Meanwhile, as price forms a higher low, an increased of volume is the ideal uptrend characteristic. If so, the 14, 21, 31 EMA would serve as the dynamic support for the uptrend as well as the trailing stop reference.

On the other hand, if price should break below the 14, 21, 31 EMA, it would suggests that the uptrend has failed for form, thus a signal to cut loss. If price should break below the RM 1.21 support, it would be a new low, suggesting that the downtrend will resume.

4 Q Rolling PER

12.76 times

Dividend Yield

1.53%

Dividend

Dividend Yield

Net Profit Ratio

31/12/2009

2 sen

1.61%

2.89%

31/12/2008

2 sen

1.65%

3.15%

31/12/2007

11 sen

2.31%

7.79%

31/12/2006

15 sen

4.31%

11.73%

31/12/2005

12 sen

5.71%

11.37%

Table 1: Pelikan, yearly dividend, dividend yield, and net profit ratio.

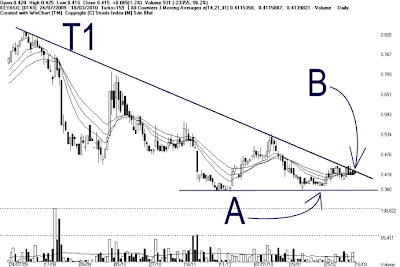
Chart 2: Keyasic, from 24/07/2009 to 17/03/2010.

As shown on chart 2, Keyasic remains resisted by the T1 downtrend, despite many attempts to break away from the T1 downtrend. As indicated by A, price of Keyasic rebounded from the RM0.36 support, and the price is consolidating, as the downtrend gradually slowed down.

As indicated by B, price of Keyasic is testing the T1 downtrend again, and if price should break above the T1 downtrend line, it would break away from the 8-months long downtrend, and the 14, 21, 31 Ema would serve as the dynamic support. However, this has to be confirmed with strong volume, and the next resistance is seen at RM 0.53 level. However, if price should remains resisted by the T1 line, and later breaking below the RM 0.36 level, it would be a new low, thus the T1 downtrend line remains intact. Therefore, it is a signal to cut loss.

4 Q Rolling PER

30.15 times

Dividend Yield

0%

Dividend

Dividend Yield

Net Profit Ratio

31/12/2009

0 sen

0%

2.89%

31/12/2008

0 sen

0%

3.15%

31/12/2007

0 sen

0%

7.79%

Table 2: Keyasic, yearly dividend, dividend yield, and net profit ratio.

Kurasia: Chance of a technical rebound.


Chart 3: Kurasia chart from 29/06/2009 to 17/03/2010.

As shown on chart 3, price of Kurasia formed a downtrend after touching its peak at RM 0.805 in November, 2009, and it has dropped about 28 sen of 35% since then; with the 14, 21, 31 EMA being the dynamic resistance.

Despite price is still trending down, it is also testing the 61.8% Fibonacci Retracement line, which suggests a chance of a technical rebound, as indicated by A. Therefore, it pays to monitor the 61.8% retracement line, and if price should rebound, its target would be the 14, 21, 31 EMA. If price should break above the 14, 21, 31 EMA, there is a chance of breaking away from the downtrend. But this has to be confirmed with strong volume.

However, if after the rebound from RM0.52 level, and price is still resisted by the 14, 21, 31 EMA, the rebound would only be considered as a technical rebound, not a reversal signal, and the downtrend remains intact. If price should break below the RM0.52 level, it would mark a new low, thus the downtrend would resume. Therefore, it is a signal to cut loss when price should break below RM0.52 level, and the next support is at RM 0.45.

4 Q Rolling PER

12.76 times

Dividend Yield

1.53%

Dividend

Dividend Yield

Net Profit Ratio

31/12/2009

0 sen

0%

8.32%

30/06/2009

0 sen

0%

5.01%

30/06/2008

0 sen

0%

-25.08%

30/06/2007

1.83 sen

1.73%

0.1%

30/06/2006

0 sen

0%

2.56%

Table 3: Kurasia, yearly dividend, dividend yield, and net profit ratio.

Conclusion:
Although all uptrend started with a technical rebound, it is still important to buy only when price started rising. Buying too early with price still dropping would result in buying into the downtrend. And never forget that a sound trading plan as important as spotting the right timing.


Copyright © 2009 Straits Index (M) Sdn BhdImportant Disclaimer:These content provided by Straits Index (M) Sdn Bhd is solely for education and information purposes only, and do not suggest any investment advices. All information displayed are believed to be accurate and reliable. Interpretation of the data or analysis is at the reader's own risk. Straits Index (M) Sdn Bhd reserves the rights but obligations to update, admen, or even terminate the materials. 重要声明:以上的内容由海峡指数(马)私人有限公司提供,纯粹是教育性质, 并不是任何的投资忠告。所有资料显示认为是准确和可靠的。对数据或分析的解释和用途是在于用户自己的风险。海峡指数(马)有限公司持有保留及义务更新,甚 至终止材料的权利。

Case Studies: Faber, Leader, Unisem.

In the field of Technical Analysis, there are Chart Patterns, Primary Indicators, and Secondary Indicators, with Chart Pattern being the most important part. For chart patterns, there are reversal patterns and consolidation patterns. For Primary Indicators, we have the Bollinger Bands and the Moving Average; and as for the Secondary Indicators, it includes MACD, Stochastic, and etc. This week, we shall take a look at some case studies with chart pattern and Primary Indicators.

Faber: Uptrend Consolidation:

Chart 1: Faber, from 16/11/2009 to 17/03/2010.

As shown on chart 1, price of Faber was trending up, but temporary has found a resistance at RM2.08 level, thus price went into a consolidation. As indicated by A, the Bollinger Bands contracted, suggesting a consolidation signal for Faber, and at the same time, implying that Faber is now gearing up for a new movement.

When the Bollinger Bands re-expands, it would be a signal suggesting a beginning of a new movement. If price should remain above the Bollinger Middle Band as the Bollinger Bands re-expands, it would be a bullish signal, suggesting that Faber is likely to resume its uptrend. On the other hand, if price should stay below the Bollinger Middle Band as the Bollinger Bands expands, it would be a bearish signal, thus a signal to take profit or to cut loss, for the next support is seen at RM 1.80 level.

4 Q Rolling PER

8.78 times

Dividend Yield

3%

Dividend

Dividend Yield

Net Profit Ratio

31/12/2009

6 sen

3.61%

10.27%

31/12/2008

4 sen

5.97%

23.29%

31/12/2007

0 sen

0%

7.76%

31/12/2006

0 sen

0%

5.95%

31/12/2005

0 sen

0%

5.98%

Table 1: Faber, yearly dividend, dividend yield, and net profit ratio.

Leader: Uptrend testing resistance.


Chart 2: Leader , from 16/11/2009 to 17/03/2010.

The T1 line as shown on chart 2 represents the uptrend line of Leader, but the resistance is at RM0.93 level. Therefore, price of Leader is forming an Ascending Triangle. An Ascending Triangle itself is a mid term uptrend pattern, but with a limited upside room capped by the resistance line. It has some bullish movement tendency but ultimately, it is the bullish break out above the resistance line that matters most. The RM0.93 resistance suggests some negative memories of traders, as it is a level where profit taking is likely to take place.

Technically, price has to break above the RM0.96 level, and then the T1 line should continue serving as the uptrend support line. Nevertheless, a bullish break out above the RM0.96 level has to be accompanied by strong volume, and the next resistance is seen at RM 1.00 level.

In contrary, if price should retreat now and break below the T1 line, it would mark an end to the mid term uptrend movement. Therefore, it would be a signal to take profit or to cut loss.

4 Q Rolling PER

7.35 times

Dividend Yield

3.33%

Dividend

Dividend Yield

Net Profit Ratio

31/12/2009

3 sen

3.31%

2.74%

31/12/2008

3 sen

6.82%

2.56%

31/12/2007

3 sen

2.75%

2.34%

31/12/2006

1.5 sen

2.65%

1.49%

31/12/2005

0 sen

0%

1.37%

Table 2: Leader, yearly dividend, dividend yield, and net profit ratio.

Unisem: Testing Resistance.


Chart 3: Unisem, from 16/11/2009 to 17/03/2010.

As shown on chart 3, price of Unisem was resisted by the RM 2.60 level, forming a Double Top pattern. A double Pattern suggests that investors have memory in the previous resistance level, and price is capped by this memory during a second rally, and as these investors take profit, price began falling, thus forming a Double Top.

Despite forming a Double Top pattern, as indicated by A, price of Unisem is still supported by the 14, 21, 31 EMA, which is serving as the dynamic support for the uptrend. But the upside room is still limited, unless price should break above the RM 2.60 level, with substantial volume.

Technical, a valid bullish break out should have strong volume together with price breaking above a resistance line. Meanwhile, investors can continue using the 14, 21, 31 EMA as the trailing guideline and provided that price is still staying above the 14, 21, 31 EMA, it is a good idea to hold, until price should break below the 14, 21, 31 EMA, it would be a signal to cut loss, or to take profit.

4 Q Rolling PER

7.35 times

Dividend Yield

3.33%

Dividend

Dividend Yield

Net Profit Ratio

31/12/2009

2.5 sen

1.14%

5.97%

31/12/2008

2.5 sen

3.57%

1.61%

31/12/2007

10 sen

6.06%

12.25%

31/12/2006

10 sen

6.06%

10.38%

31/12/2005

8 sen

5.76%

3.92%

Table 3: Unisem, yearly dividend, dividend yield, and net profit ratio.

Conclusion:
Chart Patterns, Primary and Secondary Indicators often produce contradictory signals, and therefore, an analyst has to determine when is the best time to use different method or indicator, to suit different market conditions.


Copyright © 2009 Straits Index (M) Sdn BhdImportant Disclaimer:These content provided by Straits Index (M) Sdn Bhd is solely for education and information purposes only, and do not suggest any investment advices. All information displayed are believed to be accurate and reliable. Interpretation of the data or analysis is at the reader's own risk. Straits Index (M) Sdn Bhd reserves the rights but obligations to update, admen, or even terminate the materials. 重要声明:以上的内容由海峡指数(马)私人有限公司提供,纯粹是教育性质, 并不是任何的投资忠告。所有资料显示认为是准确和可靠的。对数据或分析的解释和用途是在于用户自己的风险。海峡指数(马)有限公司持有保留及义务更新,甚 至终止材料的权利。

BlueChips: Axiata, Genting, IOIcorp.

The term “blue chips” is actually derived from the western casino. Back in those days, there were three colors of chips, with the white color chips represents the lowest value, while the red color chips is the middle value, and the blue color chips have the highest value. Eventually, in the stock market, blue chips would represent stocks that are high in value, generally valued stocks by consensus.

Chart 1: KLCI chart from 5/10/2009 to 10/03/2010.

As lead by the positive performance of stock markets abroad, the KLCI gained strength after breaking above the 14, 21, 31 EMA, it marked a 2 years new high with a gap breaking above the 1300 mark. At the same time, total market volume increases gradually, suggesting that the market sentiment is still improving, even though it has not reached the ideal level yet. As the KLCI is gaining strength, let us take a look at some blue chips counters this week.

Axiata: Consolidating after a sharp rally.

Chart 2: Axiata, from 9/11/2009 to 10/03/2010.

As indicated by A, price of Axiata broke above the RM3.50 and had a strong rally. After the strong short term rally, the Bollinger Bands is now contracting, suggesting that Axiata is consolidating, and the Bollinger Middle Band shall be the dynamic support as well as the target of the consolidation.

As indicated by B, as price of Axiata is consolidating, volume decreases significantly, suggesting that there are no panic selling sighted, thus a rather healthy consolidation. Nevertheless, if price should resume its uptrend, we need to have strong volume to confirm such move.

For now, it is a good idea to monitor the re-expansion of the Bollinger Bands, for if the Bollinger Bands should re-expand with price above the Bollinger Middle Band, it would be a signal suggesting another bullish movement. Otherwise, if the Bollinger Bands should expand with price below the Bollinger Middle Band, it would be a bearish move, thus a signal to take profit or to cut loss.

Leading PER

17.73 times

Dividend Yield

0%

Dividend

Dividend Yield

Net Profit Ratio

31/12/2009

0 sen

0%

12.61%

31/12/2008

0sen

0%

4.39%

Table 1: Axiata, yearly dividend, dividend yield, and net profit ratio.

Genting: Uptrend not confirmed.

Chart 3: Genting, chart from 19/10/2009 to 10/03/2010.

As shown on chart 3, price of Genting rebounded at RM6.20 level, and broke above the 14, 21, 31 EMA, after that, it went into a consolidation while supported by the 14, 21, 31 EMA. This suggests that Genting has temporary broken away from its bearish trend, but it has not formed an uptrend yet.

Technically, price of Genting has to formed a Higher-low, and rebound above the 14, 21, 31 EMA inorder to signal a formation of an uptrend.

If price should rebound above the 14, 21, 31 EMA, the 14, 21, 31 EMA shall serve as the dynamic support as well as the trailing stop reference. Until the price should break below the 14, 21, 31 EMA, it would be a signal to take profit or to cut loss.

4 Q Rolling PER

23.71 times

Dividend Yield

1.07%

Dividend

Dividend Yield

Net Profit Ratio

31/12/2009

7.2 sen

1.14%

11.74%

31/12/2008

7 sen

1.89%

6.27%

31/12/2007

37sen

0.98%

12.15%

31/12/2006

32sen

0.97%

21.66%

31/12/2005

29sen

1.36%

22.86%

Table 2: Genting, yearly dividend, dividend yield, and net profit ratio.

IOI Corp: Testing the resistance.


Chart 4: IOIcorp, from 14/09/2009 to 10/03/2010.

As shown on chart 4, price of IOIcorp tested the RM 5.60 resistance level many times, and as it approached the resistance, profit taking kicked in. As indicated by A, price of IOIcorp broke above the RM 5.60 level with its intra-day movement, but it failed to closed above the resistance. Therefore, this suggests that the selling pressure is still strong.

Volume started to pick up as price tested the RM 5.60 resistance again, suggesting some increased in buying interest. Therefore, technically, if price should break above the resistance with huge volume, it would be a valid break out. Then, the 14, 21, 31 EMA shall continue serving as the dynamic support for the upward movement.

4 Q Rolling PER

22.23 times

Dividend Yield

1.47%

Dividend

Dividend Yield

Net Profit Ratio

30/06/2009

8 sen

1.69%

6.74%

30/06/2008

17 sen

2.28%

15.22%

30/06/2007

7 sen

1.35%

16.55%

30/06/2006

43.5 sen

3.04%

13.81%

30/06/2005

35 sen

3.33%

14.86%

Table 3: IOIcorp yearly dividend, dividend yield, and net profit ratio.

Conclusion:
Generally, blue chips are fund managers favorite picks for long term holdings. Therefore, these blue chips usually don't come in cheap. However, despite they are perceived as strong and value stocks, their stock price could come too. Therefore, there is also risk in blue chips, and investors would still have to learn how to pick a good timing, other than picking the right blue chips.


Copyright © 2009 Straits Index (M) Sdn BhdImportant Disclaimer:These content provided by Straits Index (M) Sdn Bhd is solely for education and information purposes only, and do not suggest any investment advices. All information displayed are believed to be accurate and reliable. Interpretation of the data or analysis is at the reader's own risk. Straits Index (M) Sdn Bhd reserves the rights but obligations to update, admen, or even terminate the materials. 重要声明:以上的内容由海峡指数(马)私人有限公司提供,纯粹是教育性质, 并不是任何的投资忠告。所有资料显示认为是准确和可靠的。对数据或分析的解释和用途是在于用户自己的风险。海峡指数(马)有限公司持有保留及义务更新,甚 至终止材料的权利。

Blue Chips Banking Stocks: Maybank, CIMB, PBB.

Blue chips generally refer to counters with strong fundamental, with regular dividend payout, with a larger capital and in the traditional industries of finance. They are usually the top picks of fund managers. In Malaysia, Banking blue chips counters are generally the dominants of our local blue chips.

Chart 1: KLCI, from 15/10/2009 to 10/03/2010.

As lead by heavy weighted banking blue chips, the KLCI gapped up last week, breaking above the 1300 mark, and marked a 2 years new high. Meanwhile, total market volume was also gradually increasing, suggesting that investors might be regaining market confidence, although it has not reached the most ideal volume level yet. Nonetheless, with the KLCI still supported by the rising 14, 21, 31 EMA, together with the Bollinger Middle Band, the immediate technical outlook is still on the bullish side. In other words, the uptrend is still intact, and therefore, position traders or investors could take advantage of the positive market sentiment, and select some blue chips which has the similar trend like the KLCI. Before picking up any stocks, lets take a look at some case studies.

Maybank:


Chart 2: Maybank, from 9/11/2009 to 10/03/2010.

As shown on chart 2, price of Maybank broke above the RM 7.00 resistance level, and went up all the way to RM 7.65, but soon, profit taking took place, and price of Maybank retreated and now consolidating. As shown on the chart above, the 14, 21, 31 EMA is still serving as the dynamic support for Maybank and if price should rebound from the dynamic support, there is a good chance that the uptrend would resume.

Technical, provided that the price is still above the 14, 21, 31 EMA, it is a good idea to hold the stocks, while using the 14, 21, 31 EMA as a trailing stop reference. When price should break below the 14, 21, 31 EMA, it would be a signal to take profit or to cut loss. Next resistance for Maybank is seen at RM 7.83 WinChart Automatic Fibonacci Retracement .

4 Q Rolling PER

38.61 times

Dividend Yield

1.08%

Dividend

Dividend Yield

Net Profit Ratio

30/06/2009

8 sen

1.36%

3.93%

30/06/2008

52.5 sen

7.45%

18.13%

30/06/2007

80 sen

6.67%

20.95%

30/06/2006

85 sen

7.94%

22.07%

30/06/2005

102.5 sen

9.4%

22.31%

Table 1: Maybank, yearly dividend, dividend yield, and net profit ratio.

CIMB:

Chart 3: CIMB, from 3/11/2009 to 10/03/2010.

As shown on chart 3, price of CIMB continued its rally after breaking above the RM 13.5 resistance, while the 14, 21, 31 EMA is still serving as the dynamic support for CIMB. Therefore, the RM13.50 is an important support for CIMB.

Technically, if price should remain above the 14, 21, 31 EMA, the uptrend is still intact, until price should break below the 14, 21, 31 EMA, it would be a signal to take profit or to cut loss.

4 Q Rolling PER

15.92 times

Dividend Yield

1.46%

Dividend

Dividend Yield

Net Profit Ratio

31/12/2009

18.5 sen

1.46%

26.31%

31/12/2008

25 sen

4.27%

25.22%

31/12/2007

25 sen

2.27%

31.00%

31/12/2006

15 sen

1.94%

23.53%

31/12/2005

15 sen

2.63%

17.51%

Table 2: CIMB yearly dividend, dividend yield, and net profit ratio.

Public Bank:


Chart 4: Public Bank, chart from 3/11/2009 to 10/03/2010.

As indicated by A, price of Public Bank broke above the 14, 21, 31 EMA with a gap, rising RM0.62 or 5.5% in 1 day, and breaking away from the bearish biased trend. However, as price gets near the resistance at RM 12.14, profit taking took place, and as a result, the rally has temporary stopped.

As indicated by B, as price of Public Bank is consolidating, its trading volume also declined, which is a typical healthy correction, as the lower volume during a consolidation suggests that there were no panic selling activities. However, if price would resume its rally, a substantial increased of volume is needed to confirm such move.

The 14, 21, 31 EMA is now serving as the dynamic support as well as the trailing stop reference, thus if price should break below the 14, 21, 31 EMA, it would be a signal to take profit or to cut loss.

4 Q Rolling PER

16.20 times

Dividend Yield

4.63%

Dividend

Dividend Yield

Net Profit Ratio

31/12/2009

55 sen

4.55%

25.91%

31/12/2008

55 sen

6.21%

24.58%

31/12/2007

75 sen

6.82%

22.22%

31/12/2006

60 sen

7.74%

22.89%

31/12/2005

55 sen

8.40%

24.50%

Table 3: Public Bank, yearly dividend, dividend yield, and net profit ratio.

Conclusion:
As investors takes profit, the rally of these banking blue chips has temporary stopped. However, technically, they are still supported by the dynamic support, 14, 21, 31 EMA, thus the uptrend remains intact. If price should rebound above the 14, 21, 31 EMA there is a good chance that the uptrend would resume. Otherwise, if price should break below the 14, 21, 31 EMA, it would mark an end to this rally, thus a signal to take profit.


Copyright © 2009 Straits Index (M) Sdn BhdImportant Disclaimer:These content provided by Straits Index (M) Sdn Bhd is solely for education and information purposes only, and do not suggest any investment advices. All information displayed are believed to be accurate and reliable. Interpretation of the data or analysis is at the reader's own risk. Straits Index (M) Sdn Bhd reserves the rights but obligations to update, admen, or even terminate the materials. 重要声明:以上的内容由海峡指数(马)私人有限公司提供,纯粹是教育性质, 并不是任何的投资忠告。所有资料显示认为是准确和可靠的。对数据或分析的解释和用途是在于用户自己的风险。海峡指数(马)有限公司持有保留及义务更新,甚 至终止材料的权利。
Red Chips.

The China market has been growing at a very fast pace for the past years, and while their market is gradually opening up, the China Market even took over the Japanese Market as the worlds second largest market; and fund managers from across the world are injecting money into the China market as a form of funds, or direct investment.

In fact, other than inflow of capital into the China market, many China based companies are actually listing in stocks market away from China, and these stocks are called the “Red-Chips”. This is partially due to China has a nick name internationally as “Red China”, thus Chinese Companies listed in foreign countries are called “Red-Chip”. There were a few “Red-chips” listed in Malaysia, and these companies are designers and manufacturers of sports apparel and sports related products, and they have factories in China.

XinQuan [5155]

Chart 1: XinQuan, chart from 10/07/2009 to 4/3/2010.

When XinQuan first listed on Bursa Malaysia on the 10thof July 2009, its stock price went up to its peak of RM 1.91, but since then, it has been trending lower, and had never returned to this level. As shown on chart 1, price of XinQuan was supported at RM 1.31 level and consolidated there for about 3 months.

As indicated by A, although XinQuan attempted to break away from the downtrend, due to the lack of volume, the break out was not sustainable, and price of XinQuan returned to below the 14, 21, 31 EMA, and even broken below the RM1.31 support level, and resumed its downtrend, with the 14, 21, 31 EMA still serving as the dynamic resistance.

As indicated by B, price of XinQuan found a temporary support at RM 1.06 level and rebounded. But then again, no substantial increased of volume, and the rebound has failed to push the price away from its downtrend. If price should break below the RM 1.06 support, it would be making another new low, thus suggesting that the downtrend is still intact. Therefore, it is a signal to cut-loss.

4 Q Rolling PER

2.38 times

Dividend Yield

0%

Dividend

Net Profit

Earning Per Share

31/12/2009 (Q2)

0 sen

30,611,000

9 sen

30/09/2009 (Q1)

0 sen

23,611,000

6 sen

30/06/2009 (Q4)

0 sen

21,988,000

10 sen

31/03/2009 (Q3)

0 sen

24,921,000

11.58 sen

Table 1: XinQuan Quarterly Earning Per Share, Dividend, and Net Profit.

Msports [5150]


Chart 2: Msports chart fromm 19/08/2009 to 4/3/2010.

As shown on chart 2, Msports was listed on the 19th of August, 2009, with its price hitting its highest level at RM0.89 on its first day of listing. However, it was only an intra-day high, and since then, price of Msports has been falling. There was a sharp rebound in November, 2009, but it was rather short-term rebound, without follow through, and price soon fall back, and found a support at RM0.475 level.

As indicated by A, with the price now still below the 14, 21, 31 EMA and testing its support of RM0.475, the immediate technical outlook for Msports is still bearish biased. If price should break below the RM0.475, it would be a new low, thus suggesting that the downtrend has resumed, and it would be a signal to cut loss.

4 Q Rolling PER

2.69 times

Dividend Yield

0%

Dividend

Net Profit

Earning Per Share

31/12/2009 (Q4)

0 sen

20,939,000

6 sen

30/09/2009 (Q3)

0 sen

12,157,000

4 sen

30/06/2009 (Q2)

0 sen

13.636,000

15 sen

Table 2: Msports quarterly Earning per share, Net Profit and Dividend.

XDL [5156]


Chart 3: XDL chart from 11/11/2009 to 4/3/2010.

As shown on chart 3, XDL was listed on the 11th of November, 2009, with its daily high reaching RM 0.765 level. Just like the above two Red-chips, price of XDL has, since then, been falling, and never returned to the previous height.

Price of XDL was supported by the RM0.49 level, and consolidated there for about 2 months. However, price of XDL was mostly resisted by the 14, 21, 31 EMA, thus suggesting that the technical outlook was mostly bearish biased.

As indicated by A, price of XDL broke below the RM 0.49 support, and marked a new low, with the 14, 21, 31 still falling while serving as the dynamic resistance. Therefore, it resumed its downtrend. Until now, price of XDL is still making new low, thus the downtrend is still intact. Therefore, technically, there is no buy signal at all, and in fact, when a stock is constantly making new low, it is a signal to cut loss, for there are now reliable support until a valid rebound.

4 Q Rolling PER

2.15 times

Dividend Yield

0%

Dividend

Net Profit

Earning Per Share

31/12/2009 (Q4)

0 sen

10,175,000

3 sen

30/09/2009 (Q3)

0 sen

21,304,000

7 sen

Table 3: XDL quarterly Net Profit, Dividend, and Earning Per Share.

Conclusion:
In conclusion, the above 3 “red-chips” has been trending down since the were listed, and until now, no signs of a reversal yet. Despite their earning is showing a positive result, the only logical reason for one to hold on to their stocks is capital appreciation. Therefore, if there is no capital appreciation, and yet there is no historical proven data showing that these companies are worth holding for long term, one should find little reason to invest in these counters.


Copyright © 2009 Straits Index (M) Sdn BhdImportant Disclaimer:These content provided by Straits Index (M) Sdn Bhd is solely for education and information purposes only, and do not suggest any investment advices. All information displayed are believed to be accurate and reliable. Interpretation of the data or analysis is at the reader's own risk. Straits Index (M) Sdn Bhd reserves the rights but obligations to update, admen, or even terminate the materials. 重要声明:以上的内容由海峡指数(马)私人有限公司提供,纯粹是教育性质, 并不是任何的投资忠告。所有资料显示认为是准确和可靠的。对数据或分析的解释和用途是在于用户自己的风险。海峡指数(马)有限公司持有保留及义务更新,甚 至终止材料的权利。

ACE Market :[0025], [0005], [0152].

Many inexperienced investors have mistaken that buying a low-priced stock has lower risk than a higher-priced stock, or they believe that low-priced stock has a faster rate of capital appreciation, thus a better vehicle to make some quick money. In fact, from a different point of view, low-priced stocks are actually very high risk. This week, we shall take a look at the FBMACE market together with some case studies from the ACE Market.


Chart 1: FBMACE chart from 2/11/2009 to 3/3/2010.

As shown on chart 1, despite the KLCI has gained over 60 points since the rebound from 1224 points, the FBMACE, on the other hand, did not show any signs of improvement, but instead, falling lower. This suggests that the recent market rally is rather selective, thus now most of the counters are following the major market movement. Nevertheless, as indicated by A, the FBMACE Bollinger Bands contracted for about 2 weeks, and finally re-expanded, with the FBMACE situated below the Bollinger Middle Band. Therefore, the immediate technical outlook for the FBMACE is bearish biased.

Illiquid Counters: Lack of technical conditions.

Chart 2: LNGRES from 3/6/2009 to 3/3/2010.

As shown on chart 2, price of LNGRES is very volatile, and from its recent low RM0.135 to its range high or RM 0.195, the fluctuation is up to 44.4%. And despite the high volatility, there is no clear trend nor direction for LNGRES. This is because the trading pattern is illiquid, and therefore, the price movement behavior does not form any analyzable patterns.

As indicated by A, when a stock is very illiquid, it is highly possible that the entire day is only trading at one price, and therefore, technically, it is impossible to analyze this kind of counters.

Meanwhile, as table 1 is showing, the fundamental for LNGRES is not bad, and in fact, it is paying out dividend rather regularly, but still, due to the illiquid condition of this counters, technical analysis has no way to analyze the price movement. In other words, investors who bought this kind of counters have to bare with the extremely volatile of price and generally not suitable for short term trading nor trend trading.

4 Q Rolling PER

13.91 times

Dividend Yield

3.13%

Dividend

Dividend Yield

Net Profit Ratio

31/12/2009

0.5 sen

3.12%

7.33%

31/12/2008

1.5 sen

13.64%

16.06%

31/12/2007

1.5 sen

31.25%

7.33%

31/12/2006

2 sen

6.67%

25.82%

31/12/2005

3 sen

10%

22.44%

Table 1: LNGRES yearly Dividend, Dividend Yield, and Net Profit Ratio.

Low-priced Mininum Bid: High Cost of Trading

Chart 3: Palette chart from 7/8/2009 to 3/3/2010.

As shown on chart 3, price of Palette is now trading at a very low price, and it is fluctuating in minimum bids. Despite moving only in sideways movement, its price fluctuates as high as 37.5%. This is due to the minimum bid is half a sen, while the stock is trading at only 4 sen, and therefore, the minimum fluctuate of the price is 12.5%. In other words, if a seller who wants to sell his share at the best buying price, he would have to sell it at least 12.5% lower then the market price; or if a buyer who wants to buy it at the best selling price, he would have to pay at least 12.5% higher then the market price. In short, low-priced minimum bid counters force investors to pay higher to get int, and receive lower to get out.

Meanwhile, technical indicators including Bollinger Bands or the Moving Averages has lost its practical value in these low-priced minimum bid stocks. (Please refer to Table 3 for minimum bid table)

4 Q Rolling PER

-16 times

Dividend Yield

0%

Dividend

Dividend Yield

Net Profit Ratio

31/12/2009

0 sen

0%

-20.61%

31/12/2008

0 sen

0%

-138.17%

31/12/2007

0 sen

0%

5.62%

31/12/2006

0 sen

0%

10.62%

31/12/2005

0 sen

0%

-55.06%

Table 2: Palette, yearly dividend, dividend yield, and net profit ratio.

Price Range

Minimum Fluctuation (Sen)

Below RM 1.00

0.5

RM 1.00 to RM 9.99

1

RM 10.00 to RM 99.98

2

RM 100 and Above

10

Table 3: Minimum Bid.

Low-price and Constantly New-Low Counter:

Chart 4: DSCSOL from 9/12/2009 to 3/3/2010.

As shown on chart 4, except for the first day of its IPO, which push its price up RM 0.915, price of DSCSOL has, since then, continuously falling, despite a few minor rebound. The 14, 21, 31 EMA is still serving as the dynamic resistance as the downtrend remains intact.

Although price of DSCSOL is now as low as RM 0.25, its is still making new low constantly, as indicated by A. Therefore, investors should always remember that to buy on the right trend, is to wait until the price is moving up, not do buy while the price is trending down, this is because when buying into a downtrend, chances of getting stuck in the downtrend is much higher. Due to its constant new low, there is no reliable support at the moment, while the 14, 21, 31 EMA is still the dynamic resistance.

Leading PER

2.91 times

Dividend Yield

0%

Dividend

Dividend Yield

Net Profit Ratio

30/09/2009

18.5 sen

0%

0%

Table 4: DSCSOL yearly dividend, dividend yield, and net profit ratio.

Conclusion:
From the above examples, we can see that trading on these counters are associated with high risk. Therefore, unless one has some strong reasons, technically one should avoid these counters, especially for short term trading.


Copyright © 2009 Straits Index (M) Sdn BhdImportant Disclaimer:These content provided by Straits Index (M) Sdn Bhd is solely for education and information purposes only, and do not suggest any investment advices. All information displayed are believed to be accurate and reliable. Interpretation of the data or analysis is at the reader's own risk. Straits Index (M) Sdn Bhd reserves the rights but obligations to update, admen, or even terminate the materials. 重要声明:以上的内容由海峡指数(马)私人有限公司提供,纯粹是教育性质, 并不是任何的投资忠告。所有资料显示认为是准确和可靠的。对数据或分析的解释和用途是在于用户自己的风险。海峡指数(马)有限公司持有保留及义务更新,甚 至终止材料的权利。