Here are some highlights of the Dow Theory:
- Everything will be reflected in the price eventually.
- The average of an index must be confirmed the average of another index.
- There are primary trend, secondary trend, and minor swings.
- The market has 3 stages: Accumulation, Push, and Distribution.
- Trend has to be confirmed with volume.
- A trend shall continue until a reversal pattern is formed.
This week, we shall take a look at the practical of the Dow Theory, with a recent case study, where the news and underlying factors reflected on the price trend.
Chart analysis is a form of statistic of price history, and formation of patterns has a specific meaning, which is reflected in the price trend in a certain period of time, which in turn, shows the changes of market psychology. Because the trend and history do repeats, it is crucial for investors to understand the behavior of the market trend.
Practical Example:
Chart 1, LCL, from 18/09/2009 to 23/12/2009.
| A | Price of LCL breaks below the RM0.65 support (which has been a support for over 2 months) on the 11th of November, breaking new low, and started a downtrend with sharp falls. |
| B | LCL announced their latest quarterly result, with 9 months losses of over 58 millions. And these has cased the price of LCL gap down. |
| C | 10th of December, 2009. The negative news on Dubai financial difficulties, as well as a subsidiary of LCL failing to repay its debts, LCL share price dropped 31.2%. |
| D | 15th of December, 2009. LCL admitted as PN17 status. Price of LCL gap down again the next day, making yet another new low. |
As shown on Chart 1, price of LCL has fallen 53 cents or 81% after breaking below its RM0.65 support. The falling of price reflected the negatives news and factors of LCL, but the main concern is that even knowing the reasons behind the price fall, what can investors do, and price has already fallen.
Actually, based on the chart reading, investors could disregard the news, and only analyze the price trend. When price is showing a negative signal, it is time to take action. Because whatever the reasons, sooner or later it will be reflected on the price. Study Chart 2.
Chart 2: LCL chart from 18/09/2009 to 23/12/2009 with Bollinger Bands.
As shown on chart 2, price of LCL went into a consolidation which lasted for about 2 months, and during the consolidation, the Bollinger Bands contracted, which confirmed the consolidation signal. Meanwhile, while consolidating, price of LCL was also gearing up for a new trend. As indicated by A, the Bollinger Bands re-expanded with price of LCL below the Bollinger Middle Band, also breaking below the RM0.65 suppport, thus indicating that a new trend has begun, but unfortunately, a negative trend.
When price of LCL broke below RM0.65 support, price stayed below the Bollinger Middle Band during its downtrend, all the way until a round at RM0.29 level, then only it consolidated with the Bollinger Bands contracting signal, as indicated by B.
As indicated by C, after contracting for about 3 weeks, the Bollinger Bands re-expanded again, suggesting that the consolidation has ended and a new movement has started. However, as the Bollinger Bands expand, price of LCL was below the Bollinger Middle Band again, and therefore, price of LCL continued its downtrend after the consolidation.
In conclusion, investors could study the chart of LCL carefully, and noticed that since the negative signal at A, there were no buy signal at all during the downtrend, but sell signals. Therefore, if investors were to follow a strict trading plan, they would have cut-loss at arrow A, and avoided the massive loss.
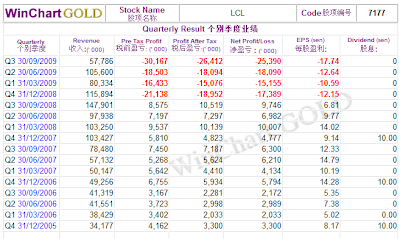
Table 1: LCL quarterly Revenue, EPS and Dividend.
As shown on table 1, the quarterly result of LCL from the year of 2005 to 2008 was rather good, and even with some dividend paid out. However, since the 4th quarter of 2008, it has started making losses. Therefore, from the fundamental point of view, the poorer financial result is also part of the reason why the share price of LCL falls as the demand of it reduced.
Conclusion:
The Dow Theory has transformed to today's technical analysis after over 100 years, while the main point of it is that everything will be eventually reflected on the price. In other words, we called the analysis of chart a market language where investors can study the behavior of price trend. The example of LCL shows that price was already forming a downtrend, even before the negative news of Dubai emerged.
Copyright © 2009 Straits Index (M) Sdn BhdImportant Disclaimer:These content provided by Straits Index (M) Sdn Bhd is solely for education and information purposes only, and do not suggest any investment advices. All information displayed are believed to be accurate and reliable. Interpretation of the data or analysis is at the reader's own risk. Straits Index (M) Sdn Bhd reserves the rights but obligations to update, admen, or even terminate the materials. 重要声明:以上的内容由海峡指数(马)私人有限公司提供,纯粹是教育性质, 并不是任何的投资忠告。所有资料显示认为是准确和可靠的。对数据或分析的解释和用途是在于用户自己的风险。海峡指数(马)有限公司持有保留及义务更新,甚 至终止材料的权利。


