Monday, January 25, 2010

January Rally and Steel Counters.

Traditionally, our local stock market generally performance well in the month of January, based on the statistic study of the past 15 years. In other words, chances for a positive performance in January is still high. With this tradition, coupled with the KLCI testing 1300 level, together with strong improvement of the market volume, market sentiment now is positive. This week, we shall look at the Steel industry and some case studies of this sectors.

Year

January Rally%

1995

-87.92 -9.1%

1996

+60.25 +6.1%

1997

-19.75 -1.6%

1998

-24.93 -4.2%

1999

+5.3 0.9%

2000

+109.77 +13.5%

2001

+48.09 +7.1%

2002

+22.73 +3.3%

2003

+18.45 +2.9%

2004

+25 +3.1%

2005

+8.84 +1%

2006

+14.22 +1.6%

2007

+93.11 +8.5%

2008

-51.78 -3.6%

2009

+7.7 +0.9%

Table, the KLCI January rally tradition.

Lionind:


Chart 1, Lionind, chart from 23/07/2009 to 13/01/2010.

As shown on the chart above, after price Lionind broke above the T1 downtrend line, it has risen 29 sen or 20%, with the 14, 21, 31 EMA serving as the dynamic support. This suggests that price of Lionind is still trending up.

As indicated by A, price of Lionind is about to test the RM 1.71 resistance level, and if price should break above the RM1.71 resistance, it would be making a 16 months new high. Nevertheless, technically, the ideal break out above the RM1.71 resistance would be a break out with strong volume. A strong volume suggests an inflow of fresh buying interests to off set the selling pressure.

Technically, 14, 21, 31 EMA is still supporting Lionind, and also serving as a trailing stop method. Provided that price of Lionind is still staying above the 14, 21, 31 EMA, the uptrend shall remain intact, and if price should break below the 14, 21, 31 EMA, it would be a signal to take profit or to cut loss.

Leading PER

4.29 times

Dividend Y

ield

0.60%

股息 (Dividend

Dividend Yield

Net Profit Ratio

30/06/2009

1 sen

0.8%

-6.06%

30/06/2008

1 sen

0.38%

12.43%

30/06/2007

1 sen

0.57%

4.36

30/06/2006

0.5 sen

0.52%

-0.29%

30/06/2005

1 sen

0.81%

8.26%

Table 2: Lionind, yearly Dividend, Dividend Yield, and Net Profit Ratio.

Annjoo

Chart 2: Annjoo, chart from 16/09/2009 to 13/01/2010.

As indicated by A, price of Annjoo broke above the RM 2.92 resistance, marking a 16 months new high. Meanwhile, price of Annjoo is still supported by the 14, 21, 31 EMA, and the 14, 21, 31 EMA is still serving as the dynamic support for Annjoo, and the uptrend is still intact.

As indicated by B, the liquidity of Annjoo is generally low, thus often gaps appear. Therefore, the price fluctuation behavior of Annjoo is difference than Lionind, Kinstel, or Huaan. Generally, stock with lower liquidity is not suitable for short term trading, and chart that has gaps is generally harder to analyse.

Nevertheless, the next resistance for Annjoo is seen at RM 3.43 WinChart Automatic Fibonacci Retracement. Technically, provided that price is still supported by the 14, 21, 31, EMA, it is a good idea to hold on to the positions, as the 14, 21, 31 EMA is also serving as the trailing stop reference. If price should break below the 14, 21, 31 EMA, it would be a signal to take profit or to cut loss.

Leading PER

129 times

Dividend Yiel

d

3.99%

Dividend

Dividend Yield

Net Profit Ratio

31/12/2008

12 sen

10.17%

6.26%

31/12/2007

16 sen

5.99%

9.89%

31/12/2006

16 sen

10.81%

7.04%

31/12/2005

3.5 sen

3.65%

3.13%

31/12/2004

16 sen

7.58%

11.96%

Table 3: Annjoo, yearly Dividend, Dividend Yield, and Net Profit Ratio.

Other Steel Counters current conditions:

Kinstel


Huaan

Name [Code]

Current

Conditions:

Kinstel [5060]

Last week, price of Kinstel broke above the 14, 21, 31 EMA, and formed a higher-low, which is an early sign of an uptrend formation. Price of Kinstel is set to test RM 1.06 resistance, while the 14, 21, 31 EMA is still serving as the dynamic support as well as the trailing stop reference. Price of Kinstel has failed to break above the RM 1.06 resistance many times thus RM 1.06 is going to be a strong resistance. Nevertheless, if price of Kinstel could break out above RM 1.06 successfully, more upside room is expected.

Huaan [2739]

Currently, price of Huaan is still trading in its trading range between the RM.475 support and RM0.575 resistance. Nonetheless, after rebounding from the RM0.475 support level on the 28thof December, 2009, price of Huaan also broke above the 14, 21, 31 EMA, forming a short term uptrend. However, price of Huaan has to break above the RM0.575 resistance in order to give more room for the uptrend to sustain.

Conclusion:
In conclusion, counters in the similar industry or sector are likely to performance similarly. With in-depth study and analysis, investors could select his favorable counter(s) in a particular sector, and at the same time, monitor other counters in the same sector to better understand the behavior of the sector as a whole.


Copyright © 2009 Straits Index (M) Sdn BhdImportant Disclaimer:These content provided by Straits Index (M) Sdn Bhd is solely for education and information purposes only, and do not suggest any investment advices. All information displayed are believed to be accurate and reliable. Interpretation of the data or analysis is at the reader's own risk. Straits Index (M) Sdn Bhd reserves the rights but obligations to update, admen, or even terminate the materials. 重要声明:以上的内容由海峡指数(马)私人有限公司提供,纯粹是教育性质, 并不是任何的投资忠告。所有资料显示认为是准确和可靠的。对数据或分析的解释和用途是在于用户自己的风险。海峡指数(马)有限公司持有保留及义务更新,甚 至终止材料的权利。

Sector and Theme

Understanding stocks in similar sector performance is an important part of trend trading. This is because stocks in the similar industry tend to performance similarly. However, for a retail trader, to buy all stocks in the same sectors is almost impossible, but at least when a trader has picked a stock, he or she should also monitor the stocks in the related sector, just to understand the behavior of the sector as a whole as well as the stock that he or she picked. This week, we shall take a look at some Steel counters.

Kinstel


Chart 1: Kinste, chart from 30/07/2009 to 13/01/2010.

As indicated by A, price of Kinstel formed a Higher-low after breaking above the 14, 21, 31 EMA. This is an early sign of an uptrend formation. Also, it has broken above the RM1.01 immediate resistance, thus is set to test the next resistance at RM 1.06. As indicated by B, volume for Kinstel increased substantially as this is a sign of positive cash flow input, thus sufficient buying interests to off set the selling pressure.

As shown on chart 1, price of Kinstel tested RM 1.06 several times, and RM1.06 is an important resistance level. If price should break above RM 1.06 successfully, more upside room is expected. Technically speaking, if volume failed to increased during a break out above RM 1.06, chances of a valid break out is slim.

Meanwhile, the 14, 21, 31 EMA shall continue serving as the dynamic support for this uptrend, as well as the trailing stop reference. Provided that price of Kinstel is still above the 14, 21, 31 EMA, it is theoretically healthy to hold on to the positions, and when price should break below the 14, 21, 31 EMA it would be a signal to take profit or to cut loss.

Leading PER

-29.15 times

Dividend Yield

1.77%

Dividend

Dividend Yield

Net Profit Ratio

31/12/2008

1.7 sen

4%

1.52%

31/12/2007

1.7 sen

1.27%

6.38%

31/12/2006

7.5 sen

4.6%

35.60%

31/12/2005

5 sen

5.49%

3.57%

31/12/2004

5 sen

2.79%

5.52%

Table 1: Kinstel Yearly Dividend, Dividend Yield, and Net Profit Ratio.

Huaan

Chart 2: Huaan, chart from 10/06/2009 to 13/01/2010.

Price of Huaan has been trading in the trading rage between RM 0.475 and RM0.575 for a considerable period of time. As shown on the chart above, RM0.475 is the support while the resistance is at RM 0.575. Technically, if price should remain in the trading range, the trend for Huaan is still unclear.

As indicated by A, price of Huaan broke above the 14, 21, 31 EMA after rebounding from the RM0.475 support on the 28th of December, 2010, and formed a short term uptrend. It is likely that it will test the RM 0.575 resistance again. Meanwhile, as indicated by B, volume also increased substantially suggesting that some increased of buying interests. Technically, if price should remain supported by the 14, 21, 31 EMA, with strong volume, chances of a valid break out above the RM0.575 would be higher.

On the contrary, if price should failed to stay above the 14, 21, 31 EMA, it would be an end to the short term uptrend, thus a signal to take profit or to cut loss, as the 14, 21, 31 EMA is serving as the dynamic support as well as the trailing stop reference.


Leading PER

-23.78 times

Dividend Yield

0.00%

Dividen

Dividend Yield

Net Profit Ratio

31/12/2008

0 sen

0%

0.04%

31/12/2007 1231

0 sen

0%

14.95%

31/12/2006

0 sen

0%

-37.95%

31/12/2005

0 sen

0%

-33.31%

31/12/2004

0 sen

0%

-246.53%

Table 2: Huaan, Yearly Dividend, Dividend Yield, and Net Profit Ratio.

Other Steel Counters:

Lionind


Annjoo

Name [code]

Current conditions:

Lionind [4235]

After breaking above the T1 downtrend line, price of Lionind has been staying in uptrend, while supported by the 14, 21, 31 EMA dynamic support. It now testing the RM 1.71 resistance, and if it could break above the RM1.71, it would be making a 16 months new high.

Annjoo [6556]

After breaking above the RM 2.92 resistance level, price of Annjoo was marking a new high while continued its uptrend. The uptrend is well supported by the 14, 21, 31 EMA dynamic support and the 14, 21, 31 EMA is also serving as the trailing stop reference. However, the liquidity of Annjoo is generally lower, thus not suitable for short term trading.

Conclusion:
Although usually a retail investor would not buy all stocks in the same sector or industry, it is still important to monitor a few counters in the similar industry to further understand the behavior of the entire sector as well as the counters bought.


Copyright © 2009 Straits Index (M) Sdn BhdImportant Disclaimer:These content provided by Straits Index (M) Sdn Bhd is solely for education and information purposes only, and do not suggest any investment advices. All information displayed are believed to be accurate and reliable. Interpretation of the data or analysis is at the reader's own risk. Straits Index (M) Sdn Bhd reserves the rights but obligations to update, admen, or even terminate the materials. 重要声明:以上的内容由海峡指数(马)私人有限公司提供,纯粹是教育性质, 并不是任何的投资忠告。所有资料显示认为是准确和可靠的。对数据或分析的解释和用途是在于用户自己的风险。海峡指数(马)有限公司持有保留及义务更新,甚 至终止材料的权利。

Case Studies [4898], [4715].

After closing the last trading day of 2009 at its daily high, the KLCI continued its rally with the Chinese New Year rally effect. However, after rising consecutively for days, the KLCI is set to consolidate. Should investors buy on dip during a consolidation? Let us look at some case studies.

Chart 1: KLCI chart from 10/9/2009 to 7/1/22010.

As shown on the chart 1, the KLCI formed an L1 descending line in December, 2009, suggesting a weakening mid term movement. However, it failed to break below the 1257 support level, which suggests that the downtrend has not formed successfully. After rebounding many times from the 1257, the KLCI finally broke above the L1 line, breaking away from the bearish biased consolidation.

As indicated by A, after breaking the L1 line, the KLCI tested the 1288 resistance, with increased of total market volume, the KLCI later also broke above the 1288 level to test the 1300 psychological barrier. The increased of volume suggest an increased of in flow of fresh capital as new buying interests increases to off set the selling pressure, thus the share price could go higher. (Study B)

Nevertheless, as the KLCI is testing the 1300 level, it shows a sign of a consolidation, but provided that the KLCI should stay above the 14, 21, 31 EMA, the uptrend shall remains intact. As the broad market is entering a consolidation, many counters will be having their technical correction or consolidation as well. Technically speaking, it is not the best time to buy during a consolidation for no body knows if the rally would resume or not, unless a valid rebound above the dynamic support (either the 14, 21, 31 EMA or the Bollinger Middle Band), with substantial volume.

Chart 2: TA, chart from 16/09/2009 to 7/1/2010.

As shown on chart 2, price of TA rebounded from the RM0.67 support, breaking above the T1 downtrend line, breaking away from the mid term bearish trend. As price breaks above the T1 line, it also break above the 14, 21, 31 EMA, thus the 14, 21, 31 EMA is now serving as the dynamic support.

As indicated by A, price of TA was resisted by the RM0.79 resistance level, while the dynamic support remains intact. It is very normal for price to retreat after hitting a resistance, but as long as the price should rebound from the 14, 21, 31 EMA, with substantial volume, as indicated by B, there is a good chance that the rally shall resume and the next resistance is seen at RM 0.85 level. For those who followed the rebound signal above the 14, 21, 31 EMA and the break out of RM0.79 as a buy signal, the immediate support would be at RM 0.79, and if price should continue rising, the 14, 21, 31 EMA or the Bollinger Middle Band as the trailing stop reference.

On the contrary, if price should continue to retreat after hitting the resistance, and break below the 14, 21, 31 EMA, it would suggest that price movement is weakening. By that time, we shall consider if the overall market condition is still favorable, if not, investors should stay on the sidelines until a clearer signal.

4 Q Rolling PER

20.70 times

Dividend Yield

6.34%

Dividend

Dividend Yield

Net Profit Ratio

31/01/2009

4.5 sen

7.32%

16.94%

31/01/2008

10 sen

7.94%

41.33%

31/01/2007

7 sen

7.95%

36.94%

31/01/2006

5 sen

6.34%

25.54%

31/01/2005

4 sen

6.98%

41.08%

Table 2: TA yearly Dividend, Dividend Yield, and Net Profit Ratio.


Chart 3: GENM, chart from 9/9/2009 to 6/1/2010.

As shown on chart 3, price of GENM formed a Rectangular Pattern trading range since September, 2009, with RM 2.72 as the resistance while the RM 2.93 as the support. This shows that there is no direction for the price movement yet, unless a valid break out above the RM 2.93 or below the RM2.72 .

As indicated by the L1 line, price of GENM might be forming an uptrend, because it has formed a higher-low on L1 line, while also breaking above the 14, 21, 31 EMA. However, as indicated by A, price of GENM is still resisted by the RM 2.93 level, and it had retreated since.

If price of GENM should stay above the 14, 21, 31 EMA or the L1, with increased of volume, there is a good chance that price of GENM would break above the RM2.93 level. Provided that the resistance is still intact, the upside room is capped at RM 2.93.

Nevertheless, if one should buy with the rebound signal above the L1, then the L1 or the 14, 21, 31 EMA shall continue serving as the dynamic support, and as long as the price is still supported by these dynamic support, one should hold his / her position. If price should break below the L1 or the 14, 21, 31 EMA, it would be a signal to take profit or cut-loss.

4 Q Rolling PER

27.42 times

Dividend Yield

1.97%

Dividend

Dividend Yield

Net Profit Ratio

31/12/2008

7 sen

3.10%

12.98%

31/12/2007

6.48 sen

1.67%

35.74%

31/12/2006

27 sen

1.85%

24.84%

31/12/2005

24 sen

2.14%

26.80%

31/12/2004

20 sen

2.00%

26.54%

Table 3: GENM, Yearly Dividend, Dividend Yield, Net Profit Ratio.

Conclusion:

In conclusion, investors should always understand that importance of follow the broad market performance, and never trade against it. During a consolidation, avoid buying heavily, and only to buy when price should rebound from the dynamic support, which suggesting a continuation of uptrend.


Copyright © 2009 Straits Index (M) Sdn BhdImportant Disclaimer:These content provided by Straits Index (M) Sdn Bhd is solely for education and information purposes only, and do not suggest any investment advices. All information displayed are believed to be accurate and reliable. Interpretation of the data or analysis is at the reader's own risk. Straits Index (M) Sdn Bhd reserves the rights but obligations to update, admen, or even terminate the materials. 重要声明:以上的内容由海峡指数(马)私人有限公司提供,纯粹是教育性质, 并不是任何的投资忠告。所有资料显示认为是准确和可靠的。对数据或分析的解释和用途是在于用户自己的风险。海峡指数(马)有限公司持有保留及义务更新,甚 至终止材料的权利。

Case Studies [5185], [7164].

FBM KLCI

The FBM KLCI ended the 2009 with some retreat but it managed to closed above the Bollinger Middle Band, thus suggesting that the immediate outlook for the KLCI was still on the positive side. On the first trading day of 2010, the Bollinger Bands expanded, with the KLCI above the Bollinger Middle Band, therefore, the KLCI continued its bullish biased movement. Let us look at two counter's case studies in line with the Chinese New Year rally.

Affin [5185]

Chart 1: Affin, chart from 9/9/2009 to 6/1/2010.

Affin continued its uptrend since March, 2009, and recently, it has tested the RM2.60 resistance level many times. As shown on chart 1, price of Affin broke above the RM 2.60 briefly on the 16/11/2009, but it failed to stay above the RM 2.60 level and retreated. Fortunately, price rebounded again and returned to above the Bollinger Middle Band, and tested the RM 2.60 level again.

As indicated by A, there is a sign that the Bollinger Bands might be expanding, thus a chance for a break out from the consolidation. With price above the Bollinger Middle Band, if the Bollinger Bands should expands, price would break above the RM 2.60 to resume its uptrend.

Technically speaking, the ideal break out signal above the RM 2.60 would be the increased of volume. As indicated by A, volume for Affin has been low, this suggests that investors were mostly staying on the sideline. The increased of volume suggests an inflow of fresh capital, as new buying interests can absorb the selling pressure, then only price could move higher above the RM 2.60.

Nevertheless, if investors should follow the bullish signal of the Bollinger Bands, the Bollinger Middle Band shall serve as the dynamic support as well as the trailing stop reference. If price of Affin should break below the Bollinger Middle Band, it would be a signal to take profit or cut-loss. Support for Affin is at RM 2.40 followed by the RM 2.26.

4 Q Rolling PER

9.81 times

Dividend Yield

1.97%

Dividend

Dividend Yield

Net Profit Ratio

31/12/2008

5

3.29%

13.84%

31/12/2007

5

1.93%

11.52%

31/12/2006

5

2.50%

30.41%

31/12/2005

4

2.55%

28.82%

31/12/2004

1

0.59%

29.33%

Table 1: Affin, yearly dividend, dividend yield, and Net profit ratio.

KNM [7164]

Chart 2: KNM, chart from 9/9/2009 to 6/1/2010.

KNM has been one of the most actively traded counters, with sufficient liquidity, and suitable for short term and trend trading. As shown on the chart 2, price of KNM broke above the L1 downtrend line, breaking away from the short term downtrend. When price breaks above the L1 line, it also breaks above the 14, 21, 31 EMA, thus the EMA is now serving as the dynamic support as well as the trailing stop reference.

Price of KNM is now resisted by the RM0.815 level, and it is having its technical correction. Technically speaking, it is normal to have a technical correction after a short rally. Provided that price of KNM could remain above the 14, 21, 31 EMA, there is still a chance for it to resume its uptrend. When price should rebound from the 14, 21, 31 EMA, it would be another buy signal, and as long as the price should stay above the 14, 21, 31 EMA, investors can hold on to the positions.

In the contrary, if price should break below the 14, 21, 31 EMA, the next support for KNM is seen at RM 0.71 level. RM 0.71 level is an important support level for KNM, if price should break below this level, it would be making a new low, thus a signal to cut-loss.

4 Q Rolling PER

10.00 times

Dividend Yield

1.97%

Dividend

Dividend Yield

Net Profit Ratio

31/12/2008

1.5 sen

3.75%

13.30%

31/12/2007

4 sen

0.63%

15.31%

31/12/2006

5 sen

0.55%

14.56%

31/12/2005

5 sen

1.36%

11.97%

31/12/2004

3 sen

1.05%

8.41%

Table 2: KNM yearly Dividend, Dividend Yield, and Net Profit Ratio.

Conclusion:
The above two case studies show unconfirmed buy signal, but it is important to get ready by knowing the characteristics of a buy signal, so that investors can get ready and have a sound trading plan laid out.


Copyright © 2009 Straits Index (M) Sdn BhdImportant Disclaimer:These content provided by Straits Index (M) Sdn Bhd is solely for education and information purposes only, and do not suggest any investment advices. All information displayed are believed to be accurate and reliable. Interpretation of the data or analysis is at the reader's own risk. Straits Index (M) Sdn Bhd reserves the rights but obligations to update, admen, or even terminate the materials. 重要声明:以上的内容由海峡指数(马)私人有限公司提供,纯粹是教育性质, 并不是任何的投资忠告。所有资料显示认为是准确和可靠的。对数据或分析的解释和用途是在于用户自己的风险。海峡指数(马)有限公司持有保留及义务更新,甚 至终止材料的权利。

Wednesday, January 6, 2010

Case Studies: [7164], [5398], [5099].

As the Dow Jones Industrial Average breaks new high, coupled with the possible Chinese New Year rally tradition, many counters are likely to rally. An informed investor should always be prepared for any opportunity as well as a sound trading plan to protect their capital. Investors should pick stocks that they are familiar with, while following the overall direction of the broad market. This week, we had 3 counters case studies for discussion.

KNM

Chart 1: KNM, chart from 10/07/2009 to 29/12/2009.

As shown on chart 1, price of KNM rebounded strongly at RM0.71 level on the 15th of September, 2009, and it reached its RM0.875 level, but failed to test the previous high of RM0.915 level. Then, price retreated, and formed a lower-high, thus forming a L1 downtrend line. Despite the falling of price, it is still supported by RM0.71, and therefore, the RM0.71 level is still the support for KNM, and investors are likely to have a positive memory at the RM0.71 level.

As indicated by A, after rebounding from the RM0.71 level, price of KNM broke above the 14, 21, 31 EMA, suggesting that it is likely to break away from the T1 downtrend. However, despite the breakout above the T1 line, volume did not increased significantly, thus the break out signal was not strong.

Nevertheless, if price of KNM should continue to stay above the 14, 21, 31 EMA, the immediate outlook for KNM is still on the positive side. If volume should increase, the upside movement of KNM is likely to sustain, and the 14, 21, 31 EMA shall continue serving as the dynamic support as well as the trailing stop reference, and the next resistance are found at RM0.815 followed by RM0.865 level.

4 Q Rolling PER

10.41 time

Dividend

Yield

1.97%

Dividend

Dividend Yield

Net Profit Ratio

31/12/2008

1.5 sen

3.75%

13.30%

31/12/2007

4 sen

0.63%

15.31%

31/12/2006

5 sen

0.55%

14.56%

31/12/2005

5 sen

1.36%

11.97%

31/12/2004

3 sen

1.05%

8.41%

Table 1: KNM yearly dividend, dividend yield, and net profit ratio.

Gamuda

Chart 2: Gamuda – 5398, from 7/10/2009 to 29/12/2009.

As shown on Chart 2, price of Gamuda has been falling since it touched its peak of RM3.44 on the 3rdof August, 2009. Until now, it has fallen RM 0.83 or 24%. As indicated by A, price of Gamuda is now testing the RM 2.60 level, which is the 38.2% Fibonacci retracement line, by taking the lowest RM 1.25 and the highest RM3.44 level.

Technically, price is likely to find a support at the 38.2% retracement line. If price should rebound from this level, it is likely that the current downtrend might pause for a consolidation. (Refer to Chart 3)

Chart 3: Gamuda – 5398, chart from 9/9/2009 to 29/12/2009.

Since Gamuda is likely to rebound at the 38.2% Fibonacci Retracement line, (RM2.60), let us study the condition of a rebound, and be prepared for a possible reversal, if it happens. As indicated by A, price of Gamuda is still staying below the Bollinger Middle Band, thus the immediate outlook is still bearish biased.

If price should rebound from the RM2.60 level, and break above the Bollinger Middle Band, the immediate outlook for Gamuda shall improve, and the next criteria for a reversal would be the re-expansion of the Bollinger Bands, coupled with a substantial increased of volume.

If the above conditions has met, investors could followed the signal as a buy signal, while the Bollinger Middle Band shall serve as the immediate dynamic support as well as the trailing stop reference.

However, if price should failed to rebound from the RM 2.60 level, it would be a new low, thus the downtrend remains intact.

4 Q Rolling PER

25.97time

Dividend Yield

3.07%

Dividend

Dividend Yield

Net Profit Ratio

31/07/2009

8 sen

2.48%

7.10%

31/07/2008

25 sen

10.9%

13.52%

31/07/2007

46 sen

5.90%

12.23%

31/07/2006

16 sen

4.57%

13.74%

31/07/2005

16 sen

3.48%

17.26%

Table 2: Gamuda, yearly dividend, dividend yield, and net profit ratio.

Air Asia:

Chart 4: Airasia – 5099, from 24/07/2009 to 29/12/2009

As shown on chart 4, price of Airasia formed an L1 uptrend line, with the rebound on the 13/11/2009 and the higher low of 8/12/2009.

Meanwhile, price of Airasia remains supported by the 14, 21, 31 EMA, which is serving as the trailing stop reference as well as the dynamic support for the L1 uptrend. Technically speaking, provided that the price of Airasia is still staying above these supports, the uptrend shall remain intact. If price of Airasia should break below the L1 line, it would be a signal to take profit.

Nevertheless, the immediate resistance for Airasia is at RM 1.40 level, while the next resistance are located at RM 1.45 and RM1.57 WinChart Automatic Fibonacci Retracement. Support for Airasia is at RM 1.27 WinChart Automatic Fibonacci Retracement.

4 Q Rolling PER

11.22 time s

Dividend Yield

0.00%

Dividend

Dividend Yield

Net Profit Ratio

31/12/2008

0 sen

0%

-17.87%

31/12/20070 sen

0 sen

0%

28.45%

30/06/2007

0 sen

0%

31.07%

30/06/2006

0 sen

0%

10.25%

30/06/2005

0 sen

0%

16.75%

Table 3: AirAsia, dividend, dividend yield, and net profit ratio.

Conclusion:
Traditionally, the Chinese New Year rally is likely to have positive effects on many individual counters, and it is crucial for investors to take advantage of these 'opportunities', provided they they are equipped with a skill to spot for signals, as well as the temperament for a sound trading plan to minimize trading risk.


Copyright © 2009 Straits Index (M) Sdn BhdImportant Disclaimer:These content provided by Straits Index (M) Sdn Bhd is solely for education and information purposes only, and do not suggest any investment advices. All information displayed are believed to be accurate and reliable. Interpretation of the data or analysis is at the reader's own risk. Straits Index (M) Sdn Bhd reserves the rights but obligations to update, admen, or even terminate the materials. 重要声明:以上的内容由海峡指数(马)私人有限公司提供,纯粹是教育性质, 并不是任何的投资忠告。所有资料显示认为是准确和可靠的。对数据或分析的解释和用途是在于用户自己的风险。海峡指数(马)有限公司持有保留及义务更新,甚 至终止材料的权利。


Case Studies [4898] , [4235]

Based on the statistic, ou market traditionally has performed well in the beginning of the year, partly due to the Chinese New Year rally effect. Meanwhile, the KLCI, as well as major indices across the globe, closed mostly higher for the year of 2009, and the positive sentiment is likely to carry on. This week, we had selected some individual counter case studies for practical application of trading signals, trading plan and trailing stop method.

Lionind 4235


Chart 1: Lionind – 4235, from 31/07/2009 to 29/12/2009.

As shown on chart 2, price of Lionind reached its recent peak of RM 1.74 in July, and started falling after that. It formed a T1 downtrend. When price was forming a downtrend, it was also staying below the falling 14, 21, 31 EMA, which served as the dynamic resistance.

In the end of November, 2009, price of Lionind stopped falling at RM 12.4 level, and entered into a consolidation stage for about 1 month long. As indicated by A, price rebounded, and broke above the 14, 21, 31 EMA. This suggests that it is likely to test the downtrend line.

Meanwhile, as indicated by B, volume of Lionind has increased slightly, and this suggests some new inflow of capital, and also the increase of buying interests. Provided that the volume should continue to increase, there is a good chance that price to break away from the downtrend.

Technically speaking, the rebound is currently a technical rebound, but not yet a bullish trend reversal. But nevertheless, investors should monitor and get ready with a trading place. If price should break above the T1 downtrend line, with substantial volume increase, it would be a signal suggesting a possible reversal of trend. Then, the 14, 21, 31 EMA shall be serving as the dynamic support as well as the trailing stop reference. Next resistance for Lionind is at RM 1.44 level.

On the other hand, if price should break below RM 1.24 support, it would be a new low, which suggest a continuation of the downtrend. Then, it is a good idea to cut loss. Next support for Lionind is at RM 1.14 followed by RM 1.00 level.

4 Q Rolling PER

0.00 times

Dividend Yield

0.75%

Dividend

Dividend Yield

Net Profit Ratio

30/06/2009

1 sen

0.64%

-6.06%

30/06/2008

1 sen

0.51%

12.43%

30/06/2007

1 sen

0.58%

4.36%

30/06/2006

0.5 sen

0.52%

-0.29%

30/06/2005

1 sen

0.81%

8.26%

Table 1: Lionind, Yearly Dividend, Dividend Yield, and Net Profit Ratio.

TA:


Chart 2: TA – 4898, from 10/09/2009 to 29/12/2009.

As shown on chart 2, price of TA started falling after reaching its top at RM 1.50 level, (after adjusted RM 0.85), and then it formed a downtrend, with T1 being the downtrend line. Although price rebounded from RM 0.745 in November, 2009, but despite the rebound, price failed to break above the T1 downtrend line, and later, price retreated and broke below the RM0.745 level, making new low, and continued its downtrend. Recently, price found its support at RM0.67 level, entered a consolidation.

When price went into a consolidation, the Bollinger Bands also contracted, which confirmed the consolidation signal. When the Bollinger Bands should re-expands, it would be a signal suggesting an end to the consolidation, and a beginning of a new movement.

As indicated by A, the Bollinger Bands of TA expanded, with price of TA above the Bollinger Middle Band, which suggests that the immediate outlook for TA has turned positive, despite being resisted by the T1 downtrend line. Nevertheless, should the Bollinger Bands continue to expand with price remain above the Bollinger Middle Band, the positive movement is expected to carry, thus price of TA is likely to break above the T1 downtrend line.

Ideally, the best bullish signal should be accompanied by strong volume. As indicated by B, if volume should increased significantly, it would be a better confirmation of a break out from the T1 downtrend, thus a buy signal. Then, the Bollinger Middle Band shall serve as the immediate dynamic support as well as the trailing stop reference.

However, since price of TA has not broken above the T1 line yet, the bullish signal is yet to be confirmed. On the other hand, if price should break below the Bollinger Middle Band or below the RM0.745 support level, it would be a signal to cut loss, and the next support for TA is at RM 0.62 level.

4 Q Rolling PER

20.70 times

Dividend Yield

6.34%

Dividend

Dividend Yield

Net Profit Ratio

31/01/2009

4.5 sen

7.32

6.94

31/01/2008

10 sen

7.94

41.33

31/01/2007

7 sen

7.95

36.94

31/01/2006

5 sen

6.34

25.54

31/01/2005

4 sen

6.98

41.08

Table 2: TA Yearly Dividend, Dividend Yield, and Net Profit Ratio.

Conclusion:
Due the the likely hood of the Chinese New Year rally, we are here to discuss some individual counter case studies, in which we could apply the theory of finding trading signals, as well as applying the trading plan and trailing stop methods. However, the KLCI is still consolidating as the Bollinger Bands is contracting, therefore, in case that the Bollinger Bands should re-expand with the KLCI below the Bollinger Middle Band, it would be a bearish biased signal.


Copyright © 2009 Straits Index (M) Sdn BhdImportant Disclaimer:These content provided by Straits Index (M) Sdn Bhd is solely for education and information purposes only, and do not suggest any investment advices. All information displayed are believed to be accurate and reliable. Interpretation of the data or analysis is at the reader's own risk. Straits Index (M) Sdn Bhd reserves the rights but obligations to update, admen, or even terminate the materials. 重要声明:以上的内容由海峡指数(马)私人有限公司提供,纯粹是教育性质, 并不是任何的投资忠告。所有资料显示认为是准确和可靠的。对数据或分析的解释和用途是在于用户自己的风险。海峡指数(马)有限公司持有保留及义务更新,甚 至终止材料的权利。

Picking Long term investment counters with Dividend Yield.

"Long term investment” is a common phrase used by many investors. However, most do not know that there are over 1000 counters listed in Bursa Malaysia, and not every one of them are suitable for long term investment. How should one pick a stock suitable for long term investment, and this week, we shall take a look at Dividend and Dividend yield as a way to filter quality counters which are suitable for long term investment.

Dividend
When a company has excessive of cash, the management could choose to re-invest them to expand the operation, or they could choose to repay some of their debts to lower the cost of interests, or they could choose to repay the share holders by dividend payout.

If a company could pay regular dividend, it is a form a passive income for long term investors. Generally conservative and long term investors prefer regular passive income from dividend. Dividend is usually taxable, but in some cases, tax exempted.

Ex-Date
The Ex-date is the date in which the amount of dividend paid out is deducted from the market share price. If a company announced a 5 cents dividend, its share price will be adjusted to 5 cents lower before the market opens on the Ex-date day.

Dividend Rate:
Dividend rate is not to be mistaken as Dividend yield. When a company is paying out dividend, they have two ways to announce it, either by stating the actual dividend payout, or by the percentage.

For example:
Maxis announced a 6 cents tax-exempted interim dividend, which means share holders will receive 6 cents of dividend for every shares they are holding.

Another examples, is Cocolnd, which announced a 5% of interim dividend. But what exactly is 5%? In fact, it is 5% of the PAR value, but not the share price. Since the PAR value of Cocolnd is 50 cents, and a 5% of 50 cents is 2.5 cent. Therefore, shareholders of Cocolnd shall receive a 2.5 cents of dividend for every share they are holding, and this is before income tax.

Dividend Yield
Dividend yield is the total dividend paid-out divided by the current share price. Let's say, a company paid out 30 cents of dividend, and the current share price is RM 3.00, its dividend yield will be 10%. Please note that the dividend yield will increase as share price drops.

In analyzing companies in the same sector, investors could use dividend yield to select a company which has a better dividend payout. Say company A and company B both paid out a dividend of 10 cents, but the share price of A is RM 2.00, and the share price of B is RM1.00. Therefore, the dividend yield of A is 5%, while the dividend yield of B is 10%.

From dividend yield point of view, company B pays a higher dividend return. However, it is important to note that the most important feature of dividend yield is not only its high yield, but the consistency. When a company pay out dividend consistently, it means that their debts are well-managed, while still have excessive cash. Thus a safer company to investors for long term dividend income. Generally, when the dividend yield is higher than the conventional fixed deposite rate, or the EPF return, it is considered as a high yield stock. Below are some examples of high-yield stocks.

Table 1: Acostec – 7120, yearly Dividend, Dividend yield, and Net profit ratio.

As shown on table 1, Acostec has been paying dividend consistently, with its dividend yield up to 11.52%. Other than the year of 2002 which has a dividend yield of 3.16%, other yearly dividend yield has been consistently higher than 5.5%.

Table 2: BAT – 4162, yearly Dividend, Dividend yield, and Net profit ratio.

Among the counters listed in Bursa Malaysia, price of BAT is the highest, but its volatility is rather low. This is because its consistent high dividend yield, which is why long term investors are not trading it actively. As shown on table 2, the yearly dividend yield of BAT has been over 6%.

Table 3: GAB – 3255, yearly Dividend, Dividend yield, and Net profit ratio.

As shown on table 3, GAB has been paying consistent dividend of more than 6.27%, which is higher than the conventional fixed deposite rate, as well as the EPF return. Therefore, this is a type of favorable company that fund managers and long term investors.

Table 4: Maybulk – 2077, yearly Dividend, Dividend yield, and Net profit ratio.

If compared with the above 3 companies, the share price of Maybulk is more volatile. But its dividend yield is no less than the others. As shown on table 4, Maybulk has been paying out dividend for the last 6 years, with the recent years yielding up to 14.44%. This is also a high yield stock.

Table 5: Pbbank – 1295, yearly Dividend, Dividend yield, and Net profit ratio.

When talking about high dividend stock, Public Bank is never a stranger. Except for the year of 2002 and 2003, which have a dividend yield lower than 4%, others yearly dividend yield has been higher than 6.29%, and 2004 was 12.68%

When is the best buying timing?
Technically, the best buying timing for such high yield stocks are after a bear run, when the broad market has just rebounded. In other words, investors should always monitor these high yield counters, but should not buy then during a bear run.

Conclusion:
Other than looking for a high yield stocks, the consistency of dividend is more important. The consistency of dividend income is very suitable for long term investors and conservative investors, and when buying this type of high yield stocks, the best timing is to catch them after a bear run when the broad market rebound.


Copyright © 2009 Straits Index (M) Sdn BhdImportant Disclaimer:These content provided by Straits Index (M) Sdn Bhd is solely for education and information purposes only, and do not suggest any investment advices. All information displayed are believed to be accurate and reliable. Interpretation of the data or analysis is at the reader's own risk. Straits Index (M) Sdn Bhd reserves the rights but obligations to update, admen, or even terminate the materials. 重要声明:以上的内容由海峡指数(马)私人有限公司提供,纯粹是教育性质, 并不是任何的投资忠告。所有资料显示认为是准确和可靠的。对数据或分析的解释和用途是在于用户自己的风险。海峡指数(马)有限公司持有保留及义务更新,甚 至终止材料的权利。

The Dow Theory.

Today, many analysts uses technical analysis based on the Dow Theory, which was originated by Charles Dow during the 19th century. It is the foundation of technical analysis.

Here are some highlights of the Dow Theory:

  • Everything will be reflected in the price eventually.
  • The average of an index must be confirmed the average of another index.
  • There are primary trend, secondary trend, and minor swings.
  • The market has 3 stages: Accumulation, Push, and Distribution.
  • Trend has to be confirmed with volume.
  • A trend shall continue until a reversal pattern is formed.

This week, we shall take a look at the practical of the Dow Theory, with a recent case study, where the news and underlying factors reflected on the price trend.

Chart analysis is a form of statistic of price history, and formation of patterns has a specific meaning, which is reflected in the price trend in a certain period of time, which in turn, shows the changes of market psychology. Because the trend and history do repeats, it is crucial for investors to understand the behavior of the market trend.

Practical Example:

Chart 1, LCL, from 18/09/2009 to 23/12/2009.

A

Price of LCL breaks below the RM0.65 support (which has been a support for over 2 months) on the 11th of November, breaking new low, and started a downtrend with sharp falls.

B

LCL announced their latest quarterly result, with 9 months losses of over 58 millions. And these has cased the price of LCL gap down.

C

10th of December, 2009. The negative news on Dubai financial difficulties, as well as a subsidiary of LCL failing to repay its debts, LCL share price dropped 31.2%.

D

15th of December, 2009. LCL admitted as PN17 status. Price of LCL gap down again the next day, making yet another new low.

As shown on Chart 1, price of LCL has fallen 53 cents or 81% after breaking below its RM0.65 support. The falling of price reflected the negatives news and factors of LCL, but the main concern is that even knowing the reasons behind the price fall, what can investors do, and price has already fallen.

Actually, based on the chart reading, investors could disregard the news, and only analyze the price trend. When price is showing a negative signal, it is time to take action. Because whatever the reasons, sooner or later it will be reflected on the price. Study Chart 2.

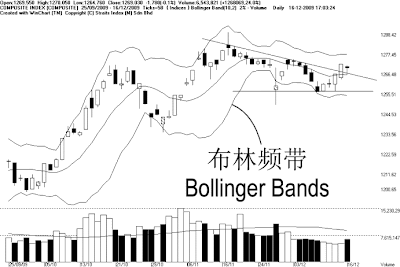
Chart 2: LCL chart from 18/09/2009 to 23/12/2009 with Bollinger Bands.

As shown on chart 2, price of LCL went into a consolidation which lasted for about 2 months, and during the consolidation, the Bollinger Bands contracted, which confirmed the consolidation signal. Meanwhile, while consolidating, price of LCL was also gearing up for a new trend. As indicated by A, the Bollinger Bands re-expanded with price of LCL below the Bollinger Middle Band, also breaking below the RM0.65 suppport, thus indicating that a new trend has begun, but unfortunately, a negative trend.

When price of LCL broke below RM0.65 support, price stayed below the Bollinger Middle Band during its downtrend, all the way until a round at RM0.29 level, then only it consolidated with the Bollinger Bands contracting signal, as indicated by B.

As indicated by C, after contracting for about 3 weeks, the Bollinger Bands re-expanded again, suggesting that the consolidation has ended and a new movement has started. However, as the Bollinger Bands expand, price of LCL was below the Bollinger Middle Band again, and therefore, price of LCL continued its downtrend after the consolidation.

In conclusion, investors could study the chart of LCL carefully, and noticed that since the negative signal at A, there were no buy signal at all during the downtrend, but sell signals. Therefore, if investors were to follow a strict trading plan, they would have cut-loss at arrow A, and avoided the massive loss.

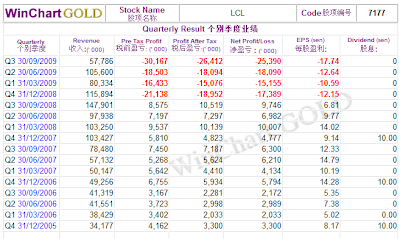
Table 1: LCL quarterly Revenue, EPS and Dividend.

As shown on table 1, the quarterly result of LCL from the year of 2005 to 2008 was rather good, and even with some dividend paid out. However, since the 4th quarter of 2008, it has started making losses. Therefore, from the fundamental point of view, the poorer financial result is also part of the reason why the share price of LCL falls as the demand of it reduced.

Conclusion:
The Dow Theory has transformed to today's technical analysis after over 100 years, while the main point of it is that everything will be eventually reflected on the price. In other words, we called the analysis of chart a market language where investors can study the behavior of price trend. The example of LCL shows that price was already forming a downtrend, even before the negative news of Dubai emerged.


Copyright © 2009 Straits Index (M) Sdn BhdImportant Disclaimer:These content provided by Straits Index (M) Sdn Bhd is solely for education and information purposes only, and do not suggest any investment advices. All information displayed are believed to be accurate and reliable. Interpretation of the data or analysis is at the reader's own risk. Straits Index (M) Sdn Bhd reserves the rights but obligations to update, admen, or even terminate the materials. 重要声明:以上的内容由海峡指数(马)私人有限公司提供,纯粹是教育性质, 并不是任何的投资忠告。所有资料显示认为是准确和可靠的。对数据或分析的解释和用途是在于用户自己的风险。海峡指数(马)有限公司持有保留及义务更新,甚 至终止材料的权利。

Bollinger Bands suitable for extended consolidation.

Last week, we mentioned that the KLCI has formed Lower-high, which is an early signal of a possible downtrend formation. However, since the Bollinger Bands did not expand, and also the KLCI precisely rebounded from the 1257 support level, and even breaking slightly above the L1 line, the KLCI might continue its consolidation rather than forming a downtrend immediately. Therefore, this week, we shall take a look at a possibility of a prolonged consolidation, which would temporary steer the KLCI away from the downtrend risk, as well as some individual counter case studies.

Chart 1: KLCI chart from 14/09/2009 to 16/12/2009.

As indicated by A, the KLCI breaks above the L1 descending line on the 15th of December, lead by heavy weighted blue chips, and therefore, showing some signs that the downtrend of the KLCI might not be forming immediately. However, as indicated by B, total market volume did not increase significantly. Technically, an ideal break out above any resistance should accompanied by substantial volume, and a break out with thin volume is likely to be a false one.

Important criteria for an uptrend:

Chart 2: KLCI with the 40-day VMA level.

As indicated by A and B, when the KLCI is moving in a healthy uptrend, total market volume has to break above the 40-day VMA level, in order to fuel the market rally with sufficient inflow of capital. This is the ideal uptrend criteria.

When volume above the 40-day VMA level, it suggests that the overall market is actively participated, thus the market is well liquid as well as the buying interest is strong enough to absorb selling pressure. Rally with thin volume is less likely to sustain.

Chart 3: KLCI with Bollinger Bands

Since market volume is generally low, and the market is lack of fresh leads. The KLCI is still fluctuating in narrow range, while not forming any prominent trend. If the KLCI should continue to trade within 1258 and 1274, investors should apply the Bollinger Bands to monitor the next move of the KLCI.

When the Bollinger Bands should re-expands, it would be a signal suggesting a beginning of a new movement after consolidation. If the KLCI should stay above the Bollinger Middle Band, it would be a bullish biased signal, but the best confirmation is that volume above the 40-day VMA level. On the other hand, if the KLCI should stay below the Bollinger Middle Band as the Bollinger Bands expands, it would be a bearish signal.

This week's Case Studies:

Chart 4: RHBCap, from 20/08/2009 to 16/12/2009.

After price of RHBCap reaching RM5.74 high on the 16thof October, it started a technical correction, but soon it found its support around RM5.20~RM5.25 level, and price rebounded. However, despite finding a support, price of RHBCap has never returned to RM5.74 level, and therefore, forming a L1 and L2 Descending Triangle,which suggest a consolidation as the price fluctuating within the Descending Triangle is getting narrower.

As indicated by A, price of RHBcap is now at the very end of the Descending Triangle, which implies that a break out is inevitable. However, due to the prolong consolidation of the KLCI, there is also a chance that RBHCap might just continue its sideways movement without forming a prominent trend. Therefore, it is best to combine the Bollinger Bands signal when price of RHBCap breaks out from the Descending Triangle.

If price should break above the L1 line, with the Bollinger Bands expanding, then it would be a bullish signal, if investors should buy with this signal, the L1 line will be a cut-loss point if price should retreat.

Of course, the most ideal signal is a valid break out above the L1 line, with the Bollinger Bands expanding while price of RHBcap stays above the Bollinger Middle Band, coupled with the increased of volume, and the Bollinger Middle Band shall serve as the dynamic support as well as the trailing stop reference.

Rolling 4 Q PE

10.81 times

Dividend Yield

3.68%

Dividend

Dividend Yield

Net Profit Ratio

31/12/2008

19.6 sen

17.48%

5.24%

31/12/2007

13.6 sen

11.58%

2.62%

31/12/2006

8 sen

7.96%

2.25%

31/12/2005

3.5 sen

8.63%

1.61%

31/12/2004

10 sen

14.22%

4.27%

Table 1: RHBCap Yearly Dividend yield, dividend and Net profit ratio.

Chart 5: Maxis, chart from 19/11/2009 to 16/12/2009.

Since the re-listing of Maxis in November, price of Maxis has been trading at a narrow range, thus the Bollinger Bands is contracting, suggesting that the price of Maxis is in deed consolidating while preparing for a new movement. When the Bollinger Bands should re-expand, it would be a signal suggesting a beginning of a new movement, and if price of Maxis should stay above the Bollinger Middle Band, it would be a bullish signal, and the immediate resistance is at RM 5.50. Otherwise, if price should stay below the Bollinger Middle Band, it would be a bearish signal for Maxis, and the next support is at RM 5.20.

Leading PE

17.24 times

Dividend Yield

0%

Table 2: Maxis PER and Dividend yield.

Conclusion:

In conclusion, the KLCI is currently extending its consolidation, and temporary avoiding its formation of a downtrend. Therefore, there is a chance that the KLCI bearish reversal formation might fail. Nevertheless, when the KLCI prolong its consolidation, the Bollinger Bands is usually more effective in detecting the next movement. When the Bollinger Bands should re-expanding, it would be a signal suggesting a beginning of the new movement.


Copyright © 2009 Straits Index (M) Sdn BhdImportant Disclaimer:These content provided by Straits Index (M) Sdn Bhd is solely for education and information purposes only, and do not suggest any investment advices. All information displayed are believed to be accurate and reliable. Interpretation of the data or analysis is at the reader's own risk. Straits Index (M) Sdn Bhd reserves the rights but obligations to update, admen, or even terminate the materials. 重要声明:以上的内容由海峡指数(马)私人有限公司提供,纯粹是教育性质, 并不是任何的投资忠告。所有资料显示认为是准确和可靠的。对数据或分析的解释和用途是在于用户自己的风险。海峡指数(马)有限公司持有保留及义务更新,甚 至终止材料的权利。

Window Dressing and Chinese New Year rally.

Due the the year end “re-adjustment” of portfolios by fund managers, the Year-end Window Dressing activities usually lift the KLCI. When the beliefs of the annual Window Dressing tradition, many investors are subscribed to the idea of a year end rally, thus created a positive biased consensus towards the year end performance of the KLCI. However, many stocks price are now started moving ahead of their positive news, and instead, price started to drop when the company announce the good news, this generally explains the saying of “Buy on rumor, sell on fact.”.

Year-end Window Dressing:

Year

December Performance

1995

+43.48 (+4.6%)

1996

+11.44 (+0.9%)

1997

+49.0 (+9.0%)

1998

84.66 (+16.9%)

1999

77.67 (+10.6%)

2000

-50.31 (-6.9%)

2001

58.07 (+9.1%)

2002

17.1 (+2.7%)

2003

14.66 (+1.9%)

2004

-9.76 (-1.1%)

2005

3.66 (+0.4%)

2006

15.58 (+1.4%)

2007

48.05 (+3.4%)

2008

10.61 (+1.2%)

2009*

8.48 (+0.7%)

Table 1: KLCI year-end performance.

Table 1 shows the statistic of the December performance from for the past 15 years, and we can see that the KLCI usually give a positive performance in December, except for the year 2000 and 2004. Based on the above statistic, the chances of a positive December performance is 86.7%.

Chinese New Year Rally.

Year

January%

Yearly %

CNY Effect.

1995

-87.92 -9.1%

+23.96 +2.5%

NO

1996

+60.25 +6.1%

+242.79 +24.4%

YES

1997

-19.75 -1.6%

-643.52 -52%

YES

1998

-24.93 -4.2%

-8.31 -1.4%

YES

1999

+5.3 0.9%

+226.2 +38.6%

YES

2000

+109.77 +13.5%

-132.69 -16.3%

NO

2001

+48.09 7.1%

+16.45 +2.4%

YES

2002

+22.73 3.3%

-49.77 -7.1%

NO

2003

+18.45 +2.9%

+147.62 +22.8%

YES

2004

+25 +3.1%

+113.49 +14.3%

YES

2005

+8.84 +1%

-7.64 -0.8%

NO

2006

+14.22 +1.6%

+196.45 +21.8%

YES

2007

+93.11 +8.5%

+348.79 +31.8%

YES

2008

-51.78 -3.6%

-568.28 -39.3%

YES

2009*

+7.7 +0.9%

+394.06 +44.9%

YES

Table 2: CNY rally and Yearly Performance of the KLCI.

Based on table 2 statistic, it shows that positive yearly performance started with a positive performance of January is 73.3%, this implies that if the January yield a positive performance, and the year that follows is likely to be positive too.

Chart 1: KLCI performance in 2009.

Therefore, by taking a guess, if the January of 2010 should produce a gain, then it is likely that the yearly performance of 2010 is positive too. As circled at A on chart 1, the KLCI only gained 7.7 points of 0.9% in January 2009, but the KLCI has gained 394 points or 45% so far.

This week's Case Studies.

Chart 2: Time, chart from 25/09/2009 to 16/12/2009.

Despite having a good chance for a Window Dressing effect, the KLCI has risen 45% this year, and it is safe to say that the KLCI is now on the higher side right now. Therefore, to avoid going against the major reversal of trend, investors can take a short term trading approach instead.

For example, Time 4456. Due the the obvious contraction of the Bollinger Bands, this suggests that price of Time is now consolidating while the beginning of a new movement is not far away. If the Bollinger Bands should re-expands, it would be a signal suggesting a beginning of a new movement and if the price of Time shall remain above the Bollinger Middle Band, it would be a positive signal.

However, due to the inconsistency of Time's fundamental, and no dividend were being paid out for many years, this counter is only good for short term trading, and definitely not a good pick for long term investment. Nevertheless, based on the latest earning report, it shows that the 3 quarters of 2009 are making profit, and its 4 quarters rolling PE is now 16.78 times, and therefore, if the 4th quarter performance of Time shall improve, chances for a rise in its stock price is high.

Most on top of all, a sound trading plan is needed when trading this stock. Therefore, investors can use the Yesterday's Low Trailing stop or the Exponential Moving Average as a trailing stop reference. When price should break below the trailing stop level, it is a signal to take profit or to cut-loss.

Table 3: Time yearly Dividend, Dividend Yield, Net Profit Ratio, PE ratio.

Table 4: Time recent quarterly earning per share, Dividend.

Other than Time, there are other counters which show similar signal with the Bollinger Bands contraction, like Sime, Redtone, and Gpacket.

Conclusion:
Both the Year-end Window Dressing and the Chinese New Year rally are a kind of statistic, and the statistic shows a good chance of positive performance with the above mentioned effects. Nevertheless, the result of the Year-end Window Dressing or the Chinese New Year Rally will be affected by conditions and the market sentiment at that time. Therefore, it is still wise to always lay out a sound trading plan in trading and to pick stock carefully, because not every counter rally during the Window Dressing or the Chinese New Year rally.


Copyright © 2009 Straits Index (M) Sdn BhdImportant Disclaimer:These content provided by Straits Index (M) Sdn Bhd is solely for education and information purposes only, and do not suggest any investment advices. All information displayed are believed to be accurate and reliable. Interpretation of the data or analysis is at the reader's own risk. Straits Index (M) Sdn Bhd reserves the rights but obligations to update, admen, or even terminate the materials. 重要声明:以上的内容由海峡指数(马)私人有限公司提供,纯粹是教育性质, 并不是任何的投资忠告。所有资料显示认为是准确和可靠的。对数据或分析的解释和用途是在于用户自己的风险。海峡指数(马)有限公司持有保留及义务更新,甚 至终止材料的权利。