Monday, November 16, 2009

Different types of PE.

Very often, investors will come across Price Earning Ratio, which is a common, and quite important financial ratio for basic analysis. Price Earning Ratio (PE) is calculated based on the latest closing price with the earning per share, and also, there is Market PE, where using the market value to compare with the earning power of underlying shares or component, in turn, investors or analysts can judge if the current price is under-value or over-value. We had mentioned how to pick stock with PE, and let us further discuss more about different types of PE this week.

Conventional PE:

Generally, a conventional PE calculation is by using the current closing price, and divided by the total earning per share of last financial year. Theoretically, its sounded logic, but however, it might be too late to reflect the price changes with last years financial performance. For example, now it is the end of October, 2009, and to calculate a conventional PE, we uses today's closing price and divide it by last years earning per share, to get a ratio. But to use last year's ratio to evaluate current price, which is 10 months apart, may seem out dated. Therefore, the reflection of the true financial chances and price changes can be unrealistic.

4 Quarters Rolling PE:

This is another approach in calculating PE, by using the last 4 quarters earning per share. Therefore, this approach is generally “closer to date” as it utilize the latest 4 quarters earning, to reflect with the current price, thus provide a better evaluation.

Leading PE:

Leading PE is another way of calculating PE, by using only the available earning per shares for the current financial year, by actualizing the current 4 quarters earning, assuming that the result should remains unchanged. For example, if a company currently only has two quarters of financial result available, Leading PE calculate the available Earning by multiplying by 2, to get an assumed total earning per share for 4 quarters. This method is purely for projection based on the behavior of the earning history of a company. Generally, when Leading PE is used together with 4 Quarter rolling PE, analysts can find out whether the company's earning is improving or not.

Other types of PE:

Other than the above three types of PE, there are also PE based on projection by estimated future earnings of a company, which is being used by Fund managers or research houses. However, to calculate this kind of PE, a huge amount of data and professional knowledge is required, and therefore, not suitable for retail investors.

Case Study on Different types of PE: Genting

Let us take a closer look of different PE calculation by using Genting as case study.

Table 1: Genting – 3182, Latest Quarterly Financial Summary.

As shown on Table 1, except for the 3rdand 4thquarters of the financial year end 2008, Genting has been making profit consistently for many years, and therefore, the losses in 3rdand 4thquarters in the year 2008 will affect the Price earning ratio drastically.

Conventional PE:

Table 2: Genting Conventional PE Calculation.

As shown on Table 2, a conventional PE calculate the ratio by using current closing price, and divided by last year's total earning per share. Based on the information, last year's total earning per share was 15.37 sen, and with the closing price on the 21/10/2009, the conventional PE for Genting should be 49.84 times. However, this is the current price movement (October 2009) with the earning power of last year (2008) which is 10 months apart. Therefore, the ratio may seem outdated. Let us take a look at another way of calculating PE for Genting.

4 Quarters Rolling PE:

Table 3: 4 Quarters Rolling PE for Genting.

As shown on table 3, the total earning per share for the latest 4 rolling quarters is 7.21 sen, with the closing price of 21/10/2009, the 4 quarter rolling PE is 106.24 times. This is because the 4 quarter rolling earning per share is much weaker than last year's earning per share.

Leading PE:

Table 4: Leading PE for Genting

As shown on table 4, there are only two available quarters for the year 2009, and therefore, we shall multiply the earning per shares for the existing 2 quarter by 2, to get a annualized total earning per share of 23.14 sen. With the closing price of 21/10/2009, the Leading PE is 33.1 times.

As you can seen the Leading PE is much lower than the 4 Quarter Rolling PE, this suggests that the current earning of Genting is improving, thus provided that the earnings for the coming quarters should remain unchanged, price of genting will be seem too expensive, relatively. In short, when Leading PE is lower than the 4 Rolling Quarters PE, this suggests that the company earning is improving. On the other hand, if the Leading PE is higher than the 4 Quarters Rolling PE, it suggests that the current earning of the company is weaker.

Meanwhile, Leading PE is also good for newly listed company, or company which does not have a complete 4 quarters earning. While other types of PE calculation requires at least 4 quarters or earning.

Behavior of PE in the Bull / Bear run.

Chart 1: Genting chart from 2008 to end of October, 2009.

As indicated by A, price of Genting touched its lowest point in March, 2009, and soon, it formed an uptrend, with the 14, 21, 31 EMA supporting the uptrend, entering a bullish trend. When stock price is rising in a bullish market, price usually move faster than the announcement of any improving earnings, and therefore, the PE will be higher in general, this is a sign of a bull market. On the other hand, when price is moving in a downtrend or a bear market, the dropping of price is faster ahead than the announcement of poorer results, thus the PE will be lower, this is a common characteristic of a bearish market.

Therefore, investors should never make any buy decision based on only PE, but instead, a thorough analysis has to be done, including dividend yield, Not profit ratios, etc, and not to mention the importance of technical analysis to fine tune the entry point and trading plan.

Conclusion:
Since there are many different types of PE calculation, investors must understand the advantages and disadvantages of each type of PE. However, in reality, timing is everything, and therefore, it is crucial to obtain the latest up-to-date information for analysis. Of course, fund managers can research and estimate earning and target price, but this is not practical for retail investors. Nonetheless, no matter which types of PE, investors must learn how to apply them properly.


Copyright © 2009 Straits Index (M) Sdn BhdImportant Disclaimer:These content provided by Straits Index (M) Sdn Bhd is solely for education and information purposes only, and do not suggest any investment advices. All information displayed are believed to be accurate and reliable. Interpretation of the data or analysis is at the reader's own risk. Straits Index (M) Sdn Bhd reserves the rights but obligations to update, admen, or even terminate the materials. 重要声明:以上的内容由海峡指数(马)私人有限公司提供,纯粹是教育性质, 并不是任何的投资忠告。所有资料显示认为是准确和可靠的。对数据或分析的解释和用途是在于用户自己的风险。海峡指数(马)有限公司持有保留及义务更新,甚 至终止材料的权利。

Exit Plan.

Successful trading is more than just finding great stock or finding the best timing, it has to do with cutting loss at the right time too with a proper exit plan. Whether you are a fund manager or a professional trader, cutting loss is inevitable, for it is part of the trading scene, and the reason to cut loss is to reduce risk while preserve capital.

Since there is no perfect formula in making money in stocks, investors has to do more than just picking stock. In short, a proper trading and exit plan is imperative, for exiting a trade is usually harder than entering one.

Partial Distribution:
When stock price breaks below a support, it is usually a signal to take profit or to cut loss, but to execute the profit taking or cutting loss, it needs courage, and failing to act accordingly would cost a fortune. Whenever an investor is in doubt, a partial distribution is always a good idea. (Reducing 1/3 or ? of the positions).

Examples of Partial Distribution: Downtrend

Chart 1: Airasia – 5099, chart from 21/12/2007 to 9/06/2008.

As indicated by A, price of Airasia rebounded after being supported at RM 1.45 level, and the Bollinger Bands also expanded clearly with price of Airasia above the Bollinger Middle Band, thus indicated a buy signal. However, due to the lack of volume, the rally failed to sustain, and later, price retreated, breaking below the Bollinger Middle Band dynamic support, forming a downtrend, thus a signal to cut loss.

As indicated by B, after breaking below the Bollinger Middle Band, price also broke below RM 1.45, and investors should take this as a cut loss point. However, it is not easy to cut loss for most investors, and therefore, it is a good idea to apply the idea of partial distribution by cutting 1/3 of the position.

As shown on the chart, after selling 1/3 of position, price moved sideways, until the re-expansion of the Bollinger Bands as indicated by C. However, as the Bollinger Bands expanded, price of Airasia was below the Bollinger Middle Band, thus a signal suggesting a formation of a downtrend. For investors who had cut loss 1/3 earlier, to selling the remaining of the position is no long difficult, for psychologically, they had already accepted an imperfect trade.

Example of Partial Distribution: Uptrend.

Chart 2: AMMB – 1015, chart from 22/06/2009 to 13/10/2009.

As indicated by A, AMMB was resisted by L1 line, at RM 4.38 level with a risk of a Double Top formation. Generally, when investors are feeling uncomfortable, it is a good idea to practice partial distribution by selling 1/3 of their position. This is to prevent the loss of paper profit when price retreat, and yet to preserve a portion of position to ride with the current uptrend for more potential upside movement.

As indicated by B, despite hitting a resistance, price of AMMB managed to rebound from the 14, 21, 31 EMA, precisely, and later breaking above the L1 resistance line, breaking new high. For investors who had reduced 1/3 position, the remaining 2/3 position will ensure that the uptrend is still profitable, and therefore, psychologically, there is not rush or great regret. In fact, investors can even top up their position at a break out point.

This week's Case Studies:
Pelikan


Chart 3: Pelikan – 5231, chart from 24/06/2009 to 15/10/2009.

As shown on chart 3, Pelikan's Bollinger Bands contracted to 2 weeks, and on the 14thof October, finally re-expanded. This suggests an end to the consolidation, while a beginning of a new movement. With the price of Pelikan above the Bollinger Middle Band as the Bollinger Bands re-expands, it suggests that the new movement is likely to be bullish biased. Therefore, provided that the Bollinger Bands should continue to expands, with price remains above the Bollinger Middle Band, there is a chance for price to rally, and even a chance to break above RM 1.75 level, and the Bollinger Middle Band shall serve as the dynamic support as well as the trailing stop reference.

When the Bollinger Bands re-expands and trigger a bullish signal, the best confirmation would be a significant increased of volume. In other words, investors should monitor the arrow B, and see if volume should increase significantly. If volume should increase along with the bullish Bollinger Bands signals, it would be a confirmation to the bullish signal.

However, if price should break below the Bollinger Middle Band, it would means a beginning of yet another consolidation or a technical correction. Then, investors should watch out for the support level at RM 1.49. If price should break below the RM 1.49 level, it would be a signal to cut loss.

Latest Financial Summary of 30/6/2009

PER*

70.22 times

Dividend Yield

1.27%

Dividend

Dividend Yield

Net Profit Ratio

31/12/2008

2sen

2.06%

3.15%

31/12/2007

11sen

2.76%

7.79%

31/12/2006

15v

4.08%

11.73%

31/12/2005

12sen

5.88%

-16.87%

31/12/2004

0sen

0%

-2.41%

Table 1: Pelikan Financial Summary

Scomi


Chart 4, Scomi – 7158, chart from 2/06/2009 to 15/10/2009.

As shown on chart 4, price of Scomi broke above the T1 downtrend line on the 14th of October, breaking away from its downtrend which lasted for 4 months. Price of Scomi tested the RM0.65 resistance level after the breakout above T1, and retreated as it was resisted by the RM 0.65 level. Generally, a break out above the T1 line does not necessary means it will form an uptrend immediately, but rather just a breakaway from a downtrend. To form a valid uptrend, price has to rebound from the 14, 21, 31 EMA while forming a higher-low, then only it has the characteristic of an uptrend formation. If investors should follow the formation of Higher-low as a buy signal, the 14, 21, 31 EMA would be serving as the trailing stop reference.

On the other hand, when price is forming a higher-low, the best confirmation would be a significant increased of volume, as indicated by B. If price should form a higher low with strong volume, there is a better chance for the uptrend to sustain until a break below the 14, 21, 31 EMA.

Support for Scomi is at RM0.56, and if price should failed to form a higher-low, and break below the RM 0.56 level, it would be a new low, thus a signal to cut loss.

Latest Financial Summary of 30/6/2009

PER*

6.73 times

Dividend Yield

0.83%

Dividend

Dividend Yield

Net Profit Ratio

31/12/2008

0.50sen

1.59%

5.53%

31/12/2007

1.25sen

1.21%

13.15%

31/12/2006

1.25sen

1.49%

5.37%

31/12/2005

1.20sen

1.21%

16.19%

31/12/2004

0.50sen

0.36%

10.41%

Table 2: Scomi Financial Summary.

Conclusion:
The main reason why investors failed to cut loss, is the worry of price rebound right after they had cut loss. Therefore, cutting loss partially would help. When price continue to fall after investors cut loss, to cut the remaining position is no longer difficult. However, when price rebound after partial cut loss, investors do not have to hurry in, because they still have positions in profit, and they can even top up their position.


Copyright © 2009 Straits Index (M) Sdn BhdImportant Disclaimer:These content provided by Straits Index (M) Sdn Bhd is solely for education and information purposes only, and do not suggest any investment advices. All information displayed are believed to be accurate and reliable. Interpretation of the data or analysis is at the reader's own risk. Straits Index (M) Sdn Bhd reserves the rights but obligations to update, admen, or even terminate the materials. 重要声明:以上的内容由海峡指数(马)私人有限公司提供,纯粹是教育性质, 并不是任何的投资忠告。所有资料显示认为是准确和可靠的。对数据或分析的解释和用途是在于用户自己的风险。海峡指数(马)有限公司持有保留及义务更新,甚 至终止材料的权利。

CPO + Plantation Counter.


Chart 1, CPO chart from 4/5/2009 to 15/10/2009.

As mentioned last week, the CPO rebounded at the 2000 point level, breaking above the 14, 21, 31 EMA, as indicated by A. This shows that the CPO has broken away from the previous downtrend, and might be forming an uptrend. If the CPO should remain above the 14, 21, 31 EMA, it is likely to form an uptrend and it would have a positive effect to plantation counters.

Case Studies on Plantation Counters:


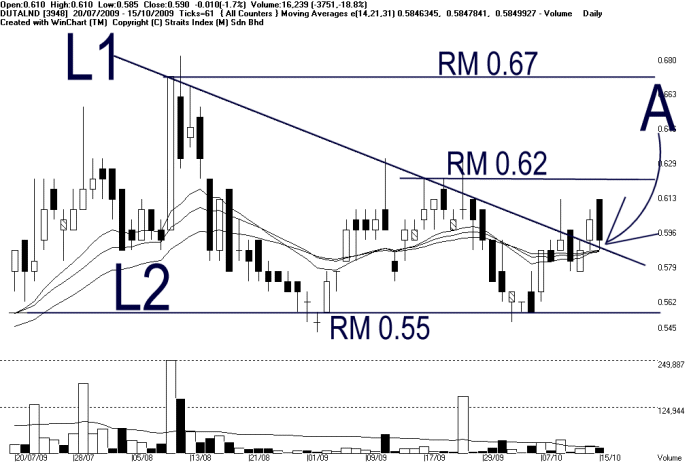
Chart 2, Dutalnd – 3948chart from 20/07/2009 to 15/10/2009.

As shown on the chart 2, price of Dutalnd formed a Descending Triangle with the L2 (RM 0.55) being the support and L1 being the dynamic resistance. As indicated by A, price of Dutalnd broke above the L1 dynamic resistance, suggesting that it is breaking away from its bearish biased consolidation, and might be forming an uptrend. If one should buy at a break out, the Bollinger Middle Band shall serve as the dynamic support as well as the trailing stop reference. Resistances for Dutalnd are found at RM 0.62 followed by RM 0.67.

If price should break below the Bollinger Middle Band, it would be a signal suggesting a weakening movement, and for investors who are holding Dutalnd shares, a crucial support is at L2 (RM0.55) level. Technically speaking, if price should break below RM0.55 level, it would be a signal to cut loss.

Latest Financial Summary of 30/6/2009

PER*

5.03 times

Dividend Yield

0 %

Dividend

Dividend Yield

Net Profit Ratio

30/06/2009

0sen

0%

66.52%

30/06/2008

0sen

0%

21.57%

30/06/2007

0sen

0%

329.71%

30/06/2006

0sen

0%

-63.61%

30/06/2005

0sen

0%

-59.96%

Table 1: Financial Summary of Dutalnd.


Chart 3, GENP – 2291, chart from 23/06/2009 to 15/10/2009.

As shown on chart 3, GENP is still forming an uptrend, and all these while been supported by the 14, 21, 31 EMA. On the 23rdof September, price of GENP was resisted at RM 6.25-RM6.28 level, and price retreated as a technical correction. However, it was still supported by the 14, 21, 31 EMA as well as RM 5.93 – RM 5.95 level. As indicated by A, after being supported by the 14, 21, 31 EMA, price of GENP rebounded, and resumed its uptrend.

As price rebounded from the 14, 21, 31 EMA, investors can apply the 14, 21, 31 EMA as the trailing stop reference. If price of GENP should remains supported by the 14, 21, 31 EMA, the uptrend is likely to continue and the first resistance is at RM 6.28 level.

If price should break below the 14, 21, 31 EMA, it would be a signal suggesting that price is having a technical correction, or a consolidation. Therefore, the next support level to watch out for is at RM 5.95 level. In other words, if price should also rebound from the RM 5.95 level, it is still alright to hold on to your positions, but however, if price should break below the RM 5.95 level, it would be a signal to cut loss, as price might form a downtrend. If investors find it hard to cut loss immediately, it is a good idea to reduce position by 1/3 at a time.

Latest Financial Summary of 30/6/2009

PER*

19.37times

Dividend Yield

1.63%

Dividend

Dividend Yield

Net Profit Ratio

31/12/2008

10sen

2.44%

36.03%

31/12/2007

14sen

1.60%

38.96%

31/12/2006

7sen

1.51%

29.68%

31/12/2005

6.25sen

2.92%

32.87%

31/12/2004

5.50sen

3.02%

33.92%

Table 2: GENP Financial Summary.

Conclusion:
Despite GENP and Dutalnd are not the main players of Plantation counters, the rebound of CPO at 2000 do have a positive effect on their price movement. Nevertheless, it is important that investors to monitor stocks in similar sector, and capture the best investment timing with a proper trading plan.


Copyright © 2009 Straits Index (M) Sdn BhdImportant Disclaimer:These content provided by Straits Index (M) Sdn Bhd is solely for education and information purposes only, and do not suggest any investment advices. All information displayed are believed to be accurate and reliable. Interpretation of the data or analysis is at the reader's own risk. Straits Index (M) Sdn Bhd reserves the rights but obligations to update, admen, or even terminate the materials. 重要声明:以上的内容由海峡指数(马)私人有限公司提供,纯粹是教育性质, 并不是任何的投资忠告。所有资料显示认为是准确和可靠的。对数据或分析的解释和用途是在于用户自己的风险。海峡指数(马)有限公司持有保留及义务更新,甚 至终止材料的权利。

Buying during an uptrend. 7158, 1015.

During a bullish market, chances for investors to pick the right stock is higher, this is because of abundant counters moving in uptrend. Therefore, when the market is bullish, it is usually a good time to buy. However, when the broad market is in a bearish trend, it is best to stay away.

Generally, a best buying timing is after a bear run, as there are more upside room in almost every stocks. It is a better strategy to buy when the stock is rebounding and forming an uptrend, rather than buying during the stock is falling. This is called buying with up trend. Other than buying a new position, topping up a new position is also applicable during a continuation of an uptrend.

It is very important to only buy during an uptrend, but many investors find this hard to bear, because when buying on an uptrend, the price is never the lowest. Nonetheless, if the uptrend has 5 correction, the last correction will mark the end of the uptrend. In other words,, during the formation of an uptrend, investor has 4 our of 5 chances to get into a right trend (80%), and only 1 out of 5 chances buying into a wrong trend (20%). This strategy contradict with the Buy low Sell high concept, and therefore, not suitable for those investors who subscribe to the idea of “Buy Low”.

We had chosen two case studies for this week, while one is to buy during an uptrend, and the other is to avoid buying during a downtrend.

Practical Case Studies:

Chart 1: Scomi – 7158, Chart from 4/6/2009 to 8/10/2009.

As shown on Chart 1, price of Scomi has reached its high of RM 0.825, and it started to retreat, forming a downtrend T1. As indicated by A, price of Scomi tested the T1 downtrend line on the 12/08/2009. Due the lack of buying interests, price failed to maintain above the T1 line, and returned to below the T1 downtrend line, and therefore, it was a false breakout. It also break below the 14, 21, 31 EMA, and therefore, it is a false breakout.

As indicated by B, after a month, price of Scomi retested the t1 downtrend line, but still resisted by the T1 line, and it suggests that the downtrend remains intact. As indicated by C, if price can break above the T1 line, with substantial volume as indicated by D, there is a chance for the price to break away from the T1 downtrend. As price break above the T1, it will be a buy signal, and investors can choose to apply the 14, 21, 31 EMA as the trailing stop reference. Current resistance for Scomi are seen at RM0.65 followed by RM0.71.

However, if price should retreated from T1 again, then the first support is at RM 0.56 level. In other words, if price should break below RM 0.56 level, it would be a new low for Scomi, and the downtrend remains intact, and investors should consider cutting loss.

Latest Financial Summary as at 30/6/2009

PER

6.67 Times

Dividend Yield

0.83%

Dividend

Dividend Yield

Net Profit Ratio

31/12/2008

0.50sen

1.59%

5.53%

31/12/2007

1.25sen

1.21%

13.15%

31/12/2006

1.25sen

1.49%

5.37%

31/12/2005

1.20sen

1.21%

16.19%

31/12/2004

0.50sen

0.36%

10.41%

Table 1: Financial Summary of Scomi.

Chart 2: AMMB – 1015, chart from 16/06/2009 to 08/10/2009.

In October 2008, price of AMMB has touched its bottom, forming a Double Bottom pattern in November, and since then, it has entered an uptrend, and until now, it has gained up to RM 2.50 or 130%. As shown on the chart, AMMB is now forming an Ascending Triangle, with L2 line being the uptrend line while L1 (RM4.40) is being the resistance.

Generally, an Ascending Triangle suggests that the price is still in an uptrend but facing a resistance (L1), causing the uptrend to temporary consolidate. As indicated by A, price of AMMB rebounded from the L2 line and the 14, 21, 31 EMA, and later also broke above the RM 4.40 level, suggesting that it is breaking away from its consolidation, and continue its uptrend.

As indicated by A, when price is breaking out above the resistance, volume has to be significantly higher to confirm the bullish breakout. Investors can following the break out signal as a buy signal, while apply the 14, 21, 31 EMA or the L2 line as the trailing stop reference. In short, provided that the price of AMMB is still supported by the rising 14, 21, 31 EMA, the uptrend is expected to continue, and investors can continue holding their shares until price should break below the 14, 21, 31 EMA, it would be a signal to take profit.

Latest Financial Summary as at 30/6/2009

PER

13.35 Times

Dividend Yield

1.78%

Dividend

Dividend Yield

Net Profit Ratio

31/03/2009

8sen

2.55%

14.69%

31/03/2008

6sen

1.56%

11.13%

31/03/2007

5sen

1.33%

-3.38%

31/03/2006

5sen

1.77%

7.34%

31/03/2005

4sen

1.42%

4.35%

Table 2: Financial Summary of AMMB

Conclusion:
When price is still trending down, it is very important not to buy too early. Investors must wait until a valid breakout above the downtrend, then only can start buying. Meanwhile, investors should always monitor if the trend is still intact, before making any trading decision. Also, before buying, investors should plan a trading plan (cut-loss plan) and therefore, when things go against investors favorable direction, investors can execute their cut-loss plan without hesitation, to avoid being trapped by the downtrend.


Copyright © 2009 Straits Index (M) Sdn BhdImportant Disclaimer:These content provided by Straits Index (M) Sdn Bhd is solely for education and information purposes only, and do not suggest any investment advices. All information displayed are believed to be accurate and reliable. Interpretation of the data or analysis is at the reader's own risk. Straits Index (M) Sdn Bhd reserves the rights but obligations to update, admen, or even terminate the materials. 重要声明:以上的内容由海峡指数(马)私人有限公司提供,纯粹是教育性质, 并不是任何的投资忠告。所有资料显示认为是准确和可靠的。对数据或分析的解释和用途是在于用户自己的风险。海峡指数(马)有限公司持有保留及义务更新,甚 至终止材料的权利。

Can CPO rebound at the 1200 psychological level? Will Plantation counters lead the market again?

With the demand of CPO is still on the rise, and the lower supply of soy bean in 4thquarter, Malaysia is likely to benefit from this as we are one of the major CPO producer. Other than finance stocks, plantation stocks are also the market leaders, and they are also fund manager's favorable counters. This week, we shall take a look at the plantation sector, and also the CPO trend.

CPO

Chart 1, CPO, chart from 21/04/2009 to 08/10/2009.

As indicated by A, CPO reached 2799 level in May, and soon, it retreated 800 points, and found its support at 2000 level (as indicated by B). After being supported at the 2000 level, it rebounded strongly and in just a month, it has regained 500 points or 26%. However, it was resisted at 2500 level as indicated by C, and started falling again, while breaking below the 14, 21, 31 EMA, forming a downtrend.

As indicated by D, CPO is now testing the 2000 psychological support level, and if CPO could rebound from this level, it would benefit the plantation sector; however, if CPO should break below 2000 level, the downtrend of the CPO shall continue, and it will have negative effects towards plantation counters.

Case Studies on Plantation Counters:

IOICorp

Chart 2: IOI Corp – 1961, chart from 28/01/2009 to 08/10/2009.

As shown on chart 2, since the rebounding from its lowest point in October 2998, price of IOI formed a long term uptrend line (T1); until now, the uptrend is still intact. However, price of IOI hit its resistance at RM 5.50 on the 14th of August, and price retreated as a technical correction. Despite a rebound in early September, price failed to break above the RM5.50 level, and resisted by RM 5.40 level, forming the L1 resistance line.

As shown on chart 2, the T1 and L2 line is actually forming an Ascending Triangle, and an Ascending Triangle suggests that price is still in an uptrend, but temporary being resisted, and consolidating. Nevertheless, should price rebound from the T1 line, it would be a buy signal with the T1 being a trailing stop reference, and for investors who had already bought, the uptrend is still favorable, thus they can still hold their positions. However, if price should resisted by the L1 line again, it can be a signal to consider partial profit taking (selling 1/3 of your positions) if you should feel uncomfortable.

The worst scenario is that price failing to rebound from T1 and breaking below the T1 uptrend line. This would mean that the uptrend has come to an end, thus a signal to take profit or to cut loss. Technically, RM 5.00 and RM 4.70 are the next support levels, while the T1 line is still the dynamic support for IOI.

Latest Financial Summary as at 30/6/2009

PER

31.71time

Dividend Yield

1.52%

Dividend

Dividend Yield

Net Profit Ratio

30/06/2009

8sen

1.57%

6.74%

30/06/2008

17sen

3.56%

15.22%

30/06/2007

7sen

1.33%

16.55%

30/06/2006

43.5sen

3.04%

13.81%

30/06/2005

35sen

3.33%

14.86%

Table 1: IOI Financial Summary.

SIME

Chart 3: Sime – 4197, chart from 16/06/2009 to 08/10/2009.

Since rebounding from its lowest point in November, 2008, price of Sime has formed an uptrend. Despite many technical corrections and consolidation, price resumed its uptrend movement. As shown on chart 3, price of Sime broke above the RM 8.40, breaking a new high. As indicated by A, currently, price of Sime is now consolidating as the Bollinger Bands is contracting. This shows that the price is also preparing for a new movement.

When the Bollinger Bands re-expands, it would be a signal suggesting an end to the consolidation, and a beginning of a new movement. And the direction of the new movement shall be determined by the relative position of price against the Bollinger Middle Band. If the Bollinger Bands should expands with price above the Bollinger Middle Band, it would be a bullish signal. Thus, a buy signal, with the Bollinger Middle Band as the trailing stop reference. However, if the Bollinger Bands should expand with price below the Bollinger Middle Band, it would be a bearish signal, thus investors should consider taking profit or cut loss. Resistance for Sime is now at RM8.64, while the supports are found at RM 8.10 followed by RM 7.77 WinChart Automatic Fibonacci Retracement.

Latest Financial Summary as at 30/6/2009

PER

22.61 times

Dividend Yield

2.37%

Dividend

Dividend Yield

Net Profit Ratio

30/06/2009

20 sen

2.46%

7.35%

30/06/2008

49sen

7.60%

10.32%

30/06/2007

30.20sen

3.11%

7.26%

30/06/2006

26sen

5.45%

5.56%

30/06/2005

26sen

4.48%

4.30%

Table 2: Financial Summary of Sime.

Conclusion:
Generally, plantation stocks are favorite of many fund managers, and therefore, provided that the market (KLCI) is still trading above the 200-day Moving Average line, plantation stocks still the major theme for the KLCI uptrend. Meanwhile, if the CPO could rebound from the 2000 support level, it would be a positive element for the plantation stocks.

No doubt, IOI and Sime are two of the most notable plantation stocks, but still there are many other plantation counters related to the CPO, and investors can apply the above studies to similar counters and decide on their investment plan, and carefully calculate the maximum risk or trading.


Copyright © 2009 Straits Index (M) Sdn BhdImportant Disclaimer:These content provided by Straits Index (M) Sdn Bhd is solely for education and information purposes only, and do not suggest any investment advices. All information displayed are believed to be accurate and reliable. Interpretation of the data or analysis is at the reader's own risk. Straits Index (M) Sdn Bhd reserves the rights but obligations to update, admen, or even terminate the materials. 重要声明:以上的内容由海峡指数(马)私人有限公司提供,纯粹是教育性质, 并不是任何的投资忠告。所有资料显示认为是准确和可靠的。对数据或分析的解释和用途是在于用户自己的风险。海峡指数(马)有限公司持有保留及义务更新,甚 至终止材料的权利。

Technical and Fundamental Analysis

Every traders' objective in trading is to make money from the stock market, but in reality, it is never easy. There must be lots of hard work, studies, and analysis, before one could decide a proper trading plan, and to execute the trading plan as planned, then only one would have a chance to succeed. Although some might be lucky and made some profit from the stock market, it is never a reliable long term trading strategy.

Technical and Fundamental Analysis:

There are two basic analysis in the stock market, one is Technical, the other is Fundamental. The idea of Technical Analysis is the study of price movement, which is trend. Basically, Technical Analysis is a statistic of price, and its is a knowledge which professional investors must have.

Fundamental is a study of company's back ground and its financial, to evaluate the value of the stock price.

A comprehensive type of investors or traders combine Technical Analysis with Fundamental, and design a trading plan before buying any stocks. In this series of article, we shall provide some thoughts and method on stock investment and analysis, with real individual counter's Case Studies. This way, readers will get to know some information and background of the company, and eventually, understand the true meaning of analysis.

Technical Chart Patterns: Triangle

In the field of Technical analysis, chart patterns analysis is considered the most important aspect, and then followed by volume, and other indicators such as RSI, Stochastic, etc, and a Triangle is most common type of chart pattern.

When a price movement is forming Symmetrical Triangle, or even other types of Triangle, such as Ascending Triangle and Descending, it means that the price is consolidating, as the fluctuation of price within the Triangle will be getting narrower, until a valid break out above or below the Triangle. A break out suggests an end to the consolidation, and a beginning of a new movement.


Chart 1: KLCI Symmetrical Triangle.

As shown in Chart 1, the KLCI formed a Symmetric Triangle from 18/05/2009 to 13/07/2009, with the L1 line being the dynamic resistance and the L2 line being the dynamic support. The KLCI consolidated within the Symmetric Triangle for about 2 months, and finally, broke above the L1 dynamic resistance line, as indicated by A. The breakout suggested that the consolidation was over, and the KLCI has started an upside movement, resuming its previous uptrend. This is a classic example of a breakout.


Chart 2: Genting, Breaking above the Symmetrical Triangle.

As shown on Chart 2, price of Genting formed a similar Symmetric Triangle around the same time as the KLCI. With L1 being the dynamic resistance while L2 being the dynamic support. After consolidating for about 2 months, price of Genting broke out above the L1 line on the 20/07/2009, breaking away from its consolidation and resumed its uptrend (Study A), and technically, this is a buy signal.

Case Studies:

Bursa – 1818, Forming Ascending Triangle.


Chart 3: Bursa – 1818, chart from 8/06/2009 to 01/10/2009.

As shown on chart 3, price of Bursa hit a resistance at RM 8.30 to RM 8.40 level, and price retreated sharply. However, as indicated by A, price of Bursa rebounded on the 3/09/2009, forming a Higher-low, which forms the T1 uptrend line. After being supported by the T1 uptrend line, price rebounded again, but hit the previous resistance at RM 8.30 and RM 8.40 level, forming an Ascending Triangle.

The Ascending Triangle suggests a consolidation of an existing uptrend, but with a resistance. Nevertheless, as long as the price of Bursa is still above the T1 uptrend line, the uptrend remains intact. If price of Bursa should rebound from the T1 again with a Higher-low, it would be a buy signal, and the T1 line shall continue serving as the Trailing Stop reference.

As for those investors who are holding Bursa shares, it is fine to hold on the stock as long as the price is above the T1 uptrend line, and if price should resisted by the RM8.30 level again, and if investors should feel uncomfortable, he or she can take partial profit, selling 1/3 of the position. This way, it will gradually reduce the trading risk, and at the same time, not taking profit too early.

If price should break below the T1 uptrend line, it means that the uptrend is no longer valid, thus the supports are at RM 7.75 followed by RM 7.55 level. Resistance shall remains at RM 8.30 and RM 8.40 level.

Latest Financial Summary as at 30/6/2009

PER*

51.06Times

Dividend Yield

2.97%

Dividend

Dividend Yield

Net Profit Ratio

31st of Dec, 2008

24.30 sen

4.81%

31.48%

31st of Dec, 2007

85 sen

6.54%

48.91%

31st of Dec, 2006

54.50sen

6.57%

41.55%

31st of Dec, 2005

20.00sen

5.46%

42.13%

31st of Dec, 2004

0sen

0%

16.06%

Table 1: Financial Summary of Bursa.

Pelikan – 5231, About to break out form a Symmetric Triangle.


Chart 4: Pelikan – 5231, Chart from 9/6/2009 to 1/10/09.

As shown on Chart 4, price of Pelikan formed a Symmetric Triangle, a consolidation pattern, with the L1 line being the dynamic resistance while the L2 line is the dynamic support. When price is consolidating within the Symmetric Triangle, the fluctuation of price is gradually reduced, which is a similar effect of the Bollinger Bands contraction. The Symmetric Triangle also implies that the price of preparing for a new movement, and new movement shall begin when price break away from the Symmetric Triangle.

As indicated by A, Pelikan is now at the breaking point of the Symmetric Triangle, which means that a break out is going to take place at any moment. If price should break above the L1 line, with substantial volume, it would be a bullish signal, thus a buy signal, and the Bollinger Middle Band shall serve as the first support and cut loss point. However, if price should break below the Symmetric Triangle, it would be a bearish signal, suggesting a beginning of a downside movement, thus a signal to cut-loss.

Bollinger Bands

With the Bollinger Bands of Pelikan is about to re-expand, investors can also refer to the Bollinger Bands for trading signals. When the Bollinger Bands re-expands, it means a beginning of a new movement after a consolidation, and if price should stay above the Bollinger Middle Band when the Bollinger Bands Width expands, it would be a buy signal. On the other hand, if the Bollinger Bands Width should re-expands with the price below the Bollinger Middle Band, it would be a bearish signal, suggesting a forming of a downside movement, thus a signal to cut loss. Nevertheless, for investors who are holding Pelikan, the support is at RM 1.48, while the resistance are found at RM 1.66 followed by RM 1.75 level.

31st of Dec, 200830/6/2009

PER *

68.44 Times

Dividend Yield

1.30%

Dividend

Dividend Yield

Net Profit Ratio

31st of Dec, 2008

2 sen

2.06%

3.15%

31st of Dec, 2007

11sen

2.76%

7.79%

31st of Dec, 2006

15sen

4.08%

11.73%

31st of Dec, 2005

12sen

5.88%

11.37%

31st of Dec, 2004

0sen

0%

-16.87%

Table 2: Pelikan Financial Summary.

* Notes on PE:

Generally, a PE (Price Earning Ratio) takes the current price and divided by the total Earning per share of last financial year. To better illustrate the current changes of the company earning, we choose to use the Rolling Price Earning Ratio, which takes the latest 4 quarters earning per share into account.

Conclusion:
The above are some of the ways of analysis, and the examples do not imply any buying tips, and readers are advised to read the analysis in detail, as the case studies is used for educational purpose, not a recommendation. Investors should understand that the investing style of individual investors and fund manager is totally different, and therefore, a proper trading plan should be laid out before deciding to buy or the sell. Of course, we shall discuss more other analysis approach in the future.

In short, making money from the stock market is never easy, and there is no magic formulas. Investing is a process of studies, and a collective of experiences, and most of the time, it is a rather boring process. In other words, there is no short cut courses in the stock market, and we have to understand, that even professional fund manager still have to study and improve themselves, and therefore, no individual investors should be making any claims that investing is easy. There is always risk in trading, and what is important is how one manage the risk, and we will be providing more Case Studies in the future.


Copyright © 2009 Straits Index (M) Sdn BhdImportant Disclaimer:These content provided by Straits Index (M) Sdn Bhd is solely for education and information purposes only, and do not suggest any investment advices. All information displayed are believed to be accurate and reliable. Interpretation of the data or analysis is at the reader's own risk. Straits Index (M) Sdn Bhd reserves the rights but obligations to update, admen, or even terminate the materials. 重要声明:以上的内容由海峡指数(马)私人有限公司提供,纯粹是教育性质, 并不是任何的投资忠告。所有资料显示认为是准确和可靠的。对数据或分析的解释和用途是在于用户自己的风险。海峡指数(马)有限公司持有保留及义务更新,甚 至终止材料的权利。
Should Investors Take Profit During A Correction?

As the markets across the globe are having correction, many of our local stocks are also having similar correction, and some are even forming a Double top pattern. Should investors take profit right now? And what about buying on dip? This week, we have chosen two case studies of stock in an uptrend, which are having a correction, to study the current trend and the proper strategy.

This week's Case Studies:

Genting – 3182: Forming Double Top.

Chart 1: Genting 3182, chart from 18/02/2009 to 1/10/2009.

As shown on Chart 1, price of Genting has been moving in an uptrend since March of 2009, and until now, it has risen up to RM 4.00 or 125%. During its uptrend, there were a few corrections, but price managed to stay above the rising 14, 21, 31 EMA, and therefore, the uptrend is still intact.

Although price broke below the 14, 21, 31 EMA briefly on the 23/06, 13/07, and 17/08, it managed to rebound, and returned to above the 14, 21, 31 EMA on the next day, and even breaking new higher afterwards. This is a typical characteristic of a bullish uptrend.

As indicated by L1, price of Genting hit a resistance at RM 7.30 level, and this is the first time that Genting is forming a Double top since the uptrend started in March. It forms a Double Top because price hit RM7.30 resistance on the 8/09, and then price retreated. However, it was supported by the 14, 21, 31 EMA and price rebound and re-tested the RM7.30 level. Unfortunately, due to the lack of buying interest, price failed to break above RM 7.30 and resisted at that level again, and as profit taking takes place, price retreated again, forming a Double Top. In other words, a Double Top increased the memory of traders who lost money at RM7.30 level, thus it is likely to be a stronger resistance level.

Although price formed a Double Top, it does not mean that it will be forming a downtrend immediately. As indicated by A, price of Genting is still testing the 14, 21, 31 EMA, which is a long term uptrend line. If price should rebound from the 14, 21, 31 EMA, there is a chance of the uptrend to resume, and of course, the immediate resistance will be at RM 7.30.

Since the uptrend of Genting is still intact, investors might not want to take profit too soon. However, if investors should feel uncomfortable of holding, they should consider partial profit taking, by selling 1/3 of the position. This way, it will gradually reduce the risk of trading, and yet, not taking profit too early.

As for investors who are interested in buying Genting, they must wait for a formation of a high low. When price formed a higher low, with substantial volume, it is a buy signal, and investors can apply the 14, 21, 31 EMA as the dynamic support as well as the Trailing Stop reference. In case price of Genting should break below the 14, 21, 31 EMA, it means that the uptrend is no longer valid, and therefore, it is a signal to take profit.

Latest Financial Summary as at 30/6/2009

PER *

97.36 times

Dividend Yield

1.00%

Dividend

Dividend Yield

Net Profit Ratio

31st of Dec, 2008

7 sen

1.98%

6.27%

31st of Dec, 2007

37sen

5.40%

23.44%

31st of Dec, 2006

32sen

0.93%

21.66%

31st of Dec, 2005

29sen

1.37%

22.86%

31st of Dec, 2004

24sen

1.26%

19.97%

Table 1: Latest Financial Summary of Genting.

* Note
Generally, a PE (Price earning ratio) is calculated using the current price and divided by the last financial year's earning per share. For this case, with the closing price of 1stof October, and divided by the total earning per share of the financial year of 2008. To better illustrate the earning performance, we had chosen to use the Rolling Price Earning Ratio, which calculate the ratio based on the latest 4 quarters earning per share.

E&O – 3417 : Testing its crucial support.


Chart 2: E&O 3417, chart from 18/20/2009 to 1/10/2009.

Since the beginning of a uptrend which started in March, price of E&O has gained RM1.17 or near 300%, and the 14, 21, 31 EMA is still serving as the dynamic support of the uptrend.

As shown on the chart, price of E&O hit its resistance at RM 1.58 level, and retreated. Now that price is testing the 14, 21, 31 EMA, it is a crucial support for the uptrend. If price should rebound, from the 14, 21, 31 EMA, it would be a buy signal, and the 14, 21, 31 EMA shall continue serving as the dynamic support and trailing stop reference.

On the other hand, if price of E&O should continue its correction, the next support is seen at RM 1.40 level. As long as price can stay above RM 1.40 level, investors who are still holding E&O share can choose to hold on to the positions, because the RM 1.40 level is also very closed to the 14, 21, 31 EMA. If price should rebound from RM 1.40 level, there is still a chance of the uptrend to resume. However, if price should break below RM 1.40, it would be a signal to suggest a profit taking or cut loss.

Latest Financial Summary as at 30/6/2009

PER**

51.06 times

Dividend Yield

0.00%

Dividend

Dividend Yield

Net Profit Ratio

31st of March, 2009

0 sen

0%

-12.45%

31st of March, 2008

5sen

3.16%

24.95%

31st of March, 2007

4sen

1.83%

5.76%

30th of June, 2006

0sen

0%

12.93%

30th of June, 2006

0sen

0%

9.30%

Table 2: E&O, Financial Summary.

** Since the total earning per share of the 4 rolling quarters of E&O is negative, the Rolling PE and Normal PE is no longer applicable to study the earning performance of E&O. Therefore, we are using the Leading Price Earning Ratio to calculate the PE ratio. Leading PE is calculated based on the annualized current financial year's earning per share, and it reflects the PE based on current year's earning performance.

Conclusion:
There is always risk in trading, and the above two Case Study analysis is using a method which we had been discussing for over 30 weeks. Investors should never feel demoralized with the idea of cutting loss, for cutting loss is part of the trading game. Instead, investors should learn to how cut loss, and re-position themselves.


Copyright © 2009 Straits Index (M) Sdn BhdImportant Disclaimer:These content provided by Straits Index (M) Sdn Bhd is solely for education and information purposes only, and do not suggest any investment advices. All information displayed are believed to be accurate and reliable. Interpretation of the data or analysis is at the reader's own risk. Straits Index (M) Sdn Bhd reserves the rights but obligations to update, admen, or even terminate the materials. 重要声明:以上的内容由海峡指数(马)私人有限公司提供,纯粹是教育性质, 并不是任何的投资忠告。所有资料显示认为是准确和可靠的。对数据或分析的解释和用途是在于用户自己的风险。海峡指数(马)有限公司持有保留及义务更新,甚 至终止材料的权利。