BJcorp – 3395: Technical Rebound.
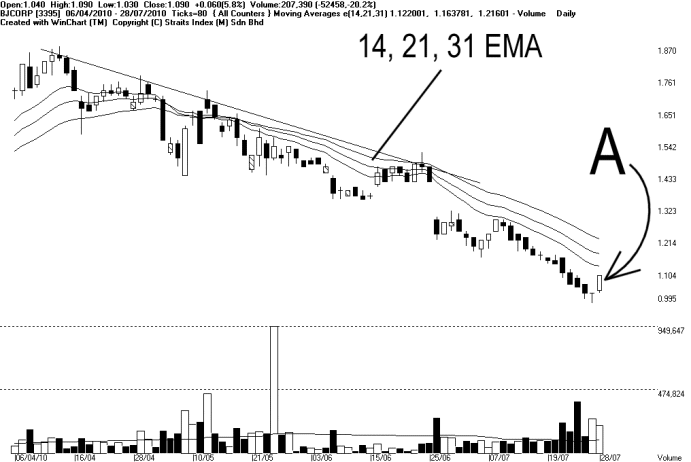
Chart 1: BJcorp – 3395 (06/04/2010 ~ 28/07/2010)
As indicated by A, price of Bjcorp rebounded on Wednesday, but it was only a technical rebound, for it is still resisted by the 14, 21, 31 EMA, which is still serving as the dynamic resistance. Therefore, the downtrend remains intact.
As shown on the chart above, there were many technical rebound during this course of downtrend, but each rebound failed to break above the dynamic resistance, and later formed a lower-high. Which is the characteristic of a downtrend.
If price should rebound but resisted by the 14, 21, 31 EMA again, it means that the downtrend is still in place, thus no buying signal yet. As for those who wanted to catch a rebound, do note that the risk is catching a rebound is high. If price should start falling again, and later break below RM0.995, itwoudl be making a new low.
Technically, the most ideal buy signal would be a valid break out above the 14, 21, 31 EMA, then followed by a mild retreat of price with thin volume, and then a rebound above the 14, 21, 31 EMA with strong volume, forming a higher-low. Nevertheless, support for Bjcorp is at RM 0.995 or RM1.00 while the resistance is still the 14, 21, 31 EMA.
| 4 Q Rolling PER | 53.17 times | Dividend Yield | 0.92% |
| Dividend | Dividend Yield | Net Profit Ratio | |
| 30/4/2010 | 1 sen | 0.79 % | 1.23 % |
| 30/4/2009 | 3.35 sen | 3.99 % | -0.83% |
| 30/4/2008 | 9 sen | 8.11 % | 17.20 % |
| 30/4/2007 | 0 sen | 0 % | 5.75 % |
| 30/4/2006 | 0 sen | 0 % | -24.33 % |
Table 1: Bjcorp, yearly dividend, dividend yield and net profit ratio.
Axiata – 6888: Testing New High.
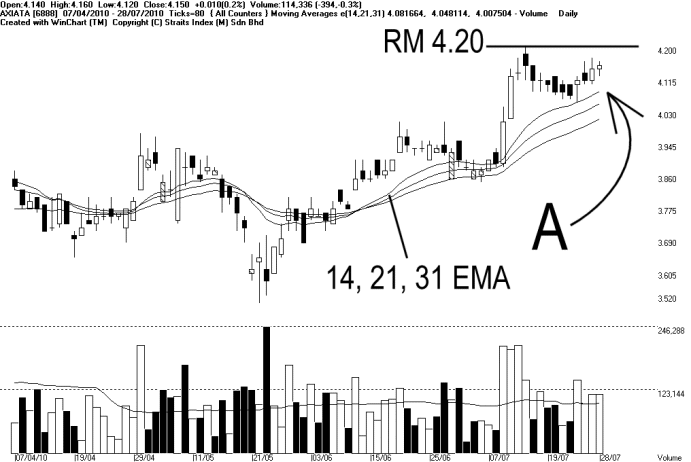
Chart 2: Axiata – 6888 (07/04/2010 ~ 28/07/2010)
After breaking above the RM3.80 resistance, it formed an uptrend, and at the same time staying above the 14, 21, 31 EMA. As shown on chart 2, it hit a high on the 14thof July, at RM4.20, and price retreated later with lesser volume. After the retreat, it managed to rebound again from the 14, 21, 31 EMA, as indicated by A, thus the uptrend is remains intact.
Currently, Axiata is about to test the RM4.20 resistance again, and if it could break above the RM4.20 it would be making a 20 months new high, and the uptrend shall continue. However, a strong volume is needed to confirm such breakout. If price should break out RM4.20 with thin volume, there is a risk of a false break out.
Nevertheless, if price should break above RM4.20, it would be a good idea to hold on to the position for those who are already in positions. As for those who are waiting to buy, an ideal buy signal would be at a higher-low. Next resistance is seen at RM5.00.
| 4 Q Rolling PER | 13.83 times | Dividend Yield | 0 % |
| Dividend | Dividend Yield | Net Profit Ratio | |
| 31/12/2009 | 0 sen | 0 % | 12.61% |
| 31/12/2008 | 0 sen | 0 % | 4.39% |
Table 2: Axiata – 6888, yearly dividend, dividend yield, and net profit ratio.
Revision of last week's Case Study: E&O – 3417: In uptrend.

Chart 3: E&O – 3417 (07/04/2010 ~ 28/07/2010)
As shown on chart 3, ever since breaking above the 14, 21, 31 EMA, E&O formed an uptrend, while supported by the 14, 21, 31 EMA. As indicated by A, after breaking above the L1 downtrend line, until now it has not had any correction yet, but instead, the rally speed up, with its price currently about 10% above the 14, 21, 31 EMA level. Therefore, as the rally speed up, it is a wiser move to tighten stop loss level. For the correction could be a sharp one.
Since the rally is speeding up, it might not be too practical to apply the 14, 21, 31 EMA as a trailing stop reference. Therefore, it would be more practical to apply “yesterday's low” as the trailing stop reference.
In short, if price should continue to rally, investors will continue to hold their share, but lift the stop loss level to yesterday's low. If price should retreat and break below yesterday's low, it would be a signal to take profit, or partial profit taking. Until the price should move sideways, then the 14, 21, 31 EMA trailing stop reference would resume.
| 4 Q Rolling PER | 16.37 time | Dividend Yield | 3.49% |
| Dividend | Dividend Yield | Net Profit Ratio | |
| 31/03/2010 | 3.8 sen | 4.29% | 20.12% |
| 31/03/2009 | 0 sen | 0% | -12.45% |
| 31/03/2008 | 5 sen | 2.78% | 24.95% |
| 31/03/2007 | 4 sen | 1.84% | 5.76% |
| 31/03/2006 | 0 sen | 0% | 12.93% |
Table 3: E&O – 3417, yearly dividend, dividend yield, and net profit ratio.
Conclusion:
Despite the KLCI is gaining strength, not all counters are moving in uptrend. Therefore, it is very important that one should pick stock carefully, and avoid stocks still trending in downtrend. As for taking up new position, it is crucial to set up an trading and cut loss plan.
Copyright © 2009 Straits Index (M) Sdn BhdImportant Disclaimer:These content provided by Straits Index (M) Sdn Bhd is solely for education and information purposes only, and do not suggest any investment advices. All information displayed are believed to be accurate and reliable. Interpretation of the data or analysis is at the reader's own risk. Straits Index (M) Sdn Bhd reserves the rights but obligations to update, admen, or even terminate the materials. 重要声明:以上的内容由海峡指数(马)私人有限公司提供,纯粹是教育性质, 并不是任何的投资忠告。所有资料显示认为是准确和可靠的。对数据或分析的解释和用途是在于用户自己的风险。海峡指数(马)有限公司持有保留及义务更新,甚 至终止材料的权利。