Chart 1: KLCI chart from 25/02/09 to 18/06/09.

Chart 2: Gamuda, from 30/01/07 to 16/10/07.
To further understand the effect of Wedge, let us review an example of Ascending Wedge in Gamuda in the year 2007.
As indicated by A, price of Gamuda formed a higher-low, which is a buy signal (RM 6.70) while using the L1 line as the trailing stop reference. An Ascending Wedge is formed by an uptrend support line (L1) and a resistance line (L2). Notice as price advance and towards the tip of the Ascending Wedge, the upside volatility of the price is gradually declining, suggesting an uptrend is weakening. This usually suggests that the uptrend is coming to its end.
As indicated by B, price of Gamuda broke below L1 uptrend line, ended its L1 uptrend, which is a sell signal. (RM 8.50). Afterward, price formed a T1 downtrend line (which lasted for 3 months). As indicated by C, price dropped from RM 8.50 to RM 5.70 during the T1 downtrend. If an investor could identify the Ascending Wedge and planned for his or her exit, he or she could had avoided the T1 downtrend. Because, even if one should bought at level A, but failed to exit at B, he would have lost all this paper profit.
Generally, most stock price fall after breaking below the Ascending Wedge, but under special circumstances like special positive announcement from a company or during a bullish broad market, stock price might not form a downtrend but will only consolidate. Therefore, investors could get ready again and be prepared for the next entry if a proper buy signal appears. (Study Chart 3).

Chart 3: Gamuda, from 30/01/07 to 16/10/07.
As indicated by D, price of Gamuda broke above the T1 downtrend line, which is a buy signal. Price pulled-back after the break out, but supported by the 14, 21, 31 EMA, which served as the dynamic support, and therefore, confirming the buy signal. Price of Gamuda was supported by the 14, 21, 31 EMA, and the rally lasted for 3 months, while the 14,21, 31 EMA being the trailing stop reference.
Now, after 2 years, price of Gamuda is forming an Ascending Wedge again. For those who are still holding its share, when is the time to take profit? As for those who are waiting to buy, when will be the best entry signal?
Case Study No1: Gamuda.
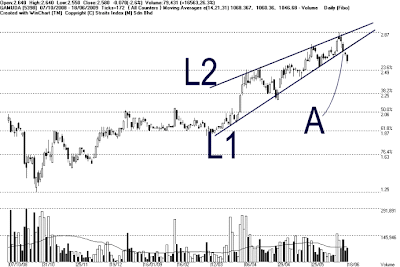
Chart 4: Gamuda, from 22/10/08 to 18/06/09.
As shown on Chart 4, price of Gamuda started rising in October, 2008, and as the broad market started to form an uptrend, price of Gamuda picked up its speed, by forming an new and steeper uptrend (L1), which lasted for 3 months. Since the rally of October, 2008, price of Gamuda had risen up to 128%. Nevertheless, other than the L1 line, price of Gamuda also form an L2 line, which is the dynamic resistance of the Ascending Wedge.
Based on the formation of the Ascending Wedge, the upside room of the Ascending Wedge is getting smaller as the upside fluctuation is gradually reducing; this suggests that the uptrend is getting weaker, and a reversal is likely to take place. As indicated by A, price of Gamuda broke below the L1 uptrend line, ended its L1 uptrend, and started its technical correction.
Generally, a pull back (rebound) is likely to take place after price break below the L1 line. If price should be resisted by the L1 after a possible pull-back, it would confirm the end of the L1 uptrend, thus a signal suggesting to take profit, as the risk of forming a downtrend is high. Resistance for Gamuda is at RM 2.87, while the supports are found at RM 2.47, RM 2.35 followed by the RM 2.22 WinChart Automatic Fibonacci Retracement line.
With the KLCI having its technical correction after breaking below its T2 uptrend line, many individual stocks are also forming Ascending Wedge. Below are a few more examples of Ascending Wedges:
Ascending Wedge Example 2: Zelan - 2283:
Chart 5: Zelan, from 25/02/09 to 18/06/09
Resistance: RM 1.12 WinChart Automatic Fibonacci Retracement line.
Support(s): RM 0.86 and RM 0.78 WinChart Automatic Fibonacci Retracement line.
Ascending Wedge Example 3: OSK - 5053:
Chart 6: OSK, from 25/02/09 to 18/06/09
Resistance: RM 1.55 WinChart Automatic Fibonacci Retracement line.
Support(s): RM 1.25 and RM 1.20 WinChart Automatic Fibonacci Retracement line.
Ascending Wedge Example 4: Unisem - 5005:
Chart 7: Unisem, from 25/02/09 to 18/06/09
Resistance: RM 1.44 WinChart Automatic Fibonacci Retracement line.
Support(s): RM 1.2 and RM 1.05 WinChart Automatic Fibonacci Retracement line.
Conclusion:
Generally, whenever a stock price is turning bullish or bearish, some form of patterns will appear. Due to the KLCI (broad market) having its technical correction, many individual counters are likely to form reversal patterns, and Ascending Wedge is one of the reversal patterns. If one should correctly indentify these Ascending Wedges, he or she could take profit at the most suitable timing and avoid unnecessary risk.
Copyright © 2009 Straits Index (M) Sdn BhdImportant Disclaimer:These content provided by Straits Index (M) Sdn Bhd is solely for education and information purposes only, and do not suggest any investment advices. All information displayed are believed to be accurate and reliable. Interpretation of the data or analysis is at the reader's own risk. Straits Index (M) Sdn Bhd reserves the rights but obligations to update, admen, or even terminate the materials. 重要声明:以上的内容由海峡指数(马)私人有限公司提供,纯粹是教育性质, 并不是任何的投资忠告。所有资料显示认为是准确和可靠的。对数据或分析的解释和用途是在于用户自己的风险。海峡指数(马)有限公司持有保留及义务更新,甚 至终止材料的权利。
Source : WinChart, Straits Index (M) Sdn Bhd http://www.straitsindex.com/
