Tuesday, July 21, 2009

Volume, the pushing hand of the rally.

Unlike the Bollinger Bands or Moving Average, volume can not indicate a straight forward buy or sell signals. However, it is an important indicator to differentiate a bull or bear run, confirming a bullish break out signal or a false break out and indicating whether the price movement is consolidating. An analysis without knowing the art of volume analysis is incomplete.

40-day Volume Moving Average (40-day VMA level)
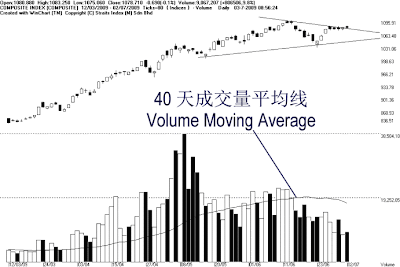
Chart 1: KLCI chart from 12/03/2009 to 02/07/2009, with 40-day Volume Moving Average.

As shown by chart 1, total market volume has been declining since 16th of June, and until now, it is still staying below the 40-day VMA level. This suggest that the inflow of fresh capital is relatively low, thus implying the market confidence is still weak. In other words, provided that the market volume is still below the 40-day VMA level, the KLCI is less likely to pick up its strength.

Analysis of the total market volume is important for if the overall market is weak, performance of the individual stock will be affected. This is why, we have always include volume analysis in our daily market analysis.


Chart 2: KLCI chart from October, 2005 to June, 2009, with 40-weeks Volume Moving Average.

As shown on chart 2, whenever the KLCI is having a bull run, volume is strongly above the Volume Moving Average, and if the KLCI is trending down, volume is below the Volume Moving Average. As indicated by A, the KLCI touched a new high of 1524.69, but volume on the other hand, failed to maintain above the 40-week Volume Moving Average, this is an important warning signal investors can not afford to miss.

When the KLCI is breaking new high, but volume is declining, this shows that the market rally is coming to an end, thus investors has to be prepared to take profit. It is because if the KLCI should have a correction, despite a mild correction, individual stocks would have a leveraged negative effect of the technical correction.

True meaning of Volume:

At any given time, every share issued by a listed company is being held by some investors, and therefore, when volume is increasing or declining, it does not mean an increasing or declining of share issued, but rather the frequency of trading, which means the changes of ownership from one investor to another. This may seem insignificant, but if the price should increase or decrease as a result of changing of ownership, there is an important message behind this.

Any positive factors could be the reasons of any price hike, but deep down, the mechanism which caused the price to move higher is because of a buyer is willing to pay a higher to obtain the share from a seller who is not willing to sell at a lower price. This is a sign of a positive capital inflow. If price should increased but volume failed to increase, this means that the inflow of fresh capital is relatively insufficient, thus the rally is unlikely to sustain. On the other hand, if price should increased with volume also increasing, this shows that the inflow of fresh capital is strong and the new buyers are willing to pay a higher price to buy shares from the sellers, thus off-setting the selling pressure, and therefore, the rally is well supported.

Last view this from another angle. Whenever a seller is selling his share, be it profit taking or cutting losses, the only reason for him to sell is because he is no-longer feeling confident with the stock at that price. In other words, the idea of selling is caused by his fear. Whenever a buyer is buying, whether a new position or topping up his positions, he must be confident with the stock at that particular price, in other words, it is his greed that gives his confidence. Therefore, when price should increase with volume increasing, it is a sign of more inflow of greed to offset the fear of the market, only then the rally can go on. (Study Chart 3).


Chart 3: TA – 4898 chart from 18/12/08 to 23/04/09, breaking above Ascending Triangle.

As shown on chart 3, price of TA formed an Ascending Triangle with L1 being the dynamic support while L2 being the resistance. As indicated by A, price of TA had a few attempts to break the L2 line, and finally breaking above the L2 line with substantial volume as indicated by B. The strong increased of volume suggests a strong inflow of fresh capital, sufficient to absorb the selling pressures at RM0.65 level. This is a typical strong bullish break out in technical analysis.

However, in reality, not all bullish break out is supported with strong volume. If price should break a resistance without strong volume, the break out signal is less reliable. However, investors can still treat the break out as a buy signal, but with cautions and proper trading plan, and must be prepared to cut loss if price should reverse after the break out.

Strong volume but price decline?

The increased of volume does not necessary give a positive signal. Sometimes, despite strong volume or fresh inflow of capital, but if the buyers are only willing to pay a lower price, and the sellers are more aggressive in selling because of stronger fear, price would fall with huge volume.

Strong volume causes a strong resistance.


Chart 4: Time 4456 chart from 12/03/09 to 02/07/09.

As indicate by A, price of Time Engineering Bhd increased on the 29th of June, and on the 30th of June, the rally continued, but soon selling began as the price was over-heated. It is rather normal to have technical correction after an over-heated condition. However, as indicated by B, volume on the 30th of June increased significantly. Therefore, the high volume associated with price fall actually suggests that selling pressure was stronger than the buying interests as buyers were only willing to buy at a lower price while sellers did not mind selling a bit lower aggressively. Therefore, this has increased the selling pressure, further dampen the negative sentiment.

With the KLCI entering a consolidation, many counters are having technical corrections, and even some has formed a short term downtrend. As long as price of these downtrend stocks is still staying below the downtrend line, investors should resist from buying. However, if the KLCI should break above 1095.91 resistance and price of the individual stock should break above the downtrend line, it would be a first trading buy signal, and of course, the best confirmation of such break out would be a strong volume associated with price breaking above the downtrend line.

Conclusion:
Volume analysis can not stand alone, it must be analyzed together with the price movement. If price and volume increases together, it means the buyers are willing to pay a higher price to obtain shares from the sellers, thus sustaining the rally. On the other hand, if price should decline with volume increasing, it suggests that the sellers are more aggressive in selling their shares without asking for more premium, and the buyers willing to buy only at a lower price, thus further dampen the sentiment of the downtrend.


Copyright © 2009 Straits Index (M) Sdn BhdImportant Disclaimer:These content provided by Straits Index (M) Sdn Bhd is solely for education and information purposes only, and do not suggest any investment advices. All information displayed are believed to be accurate and reliable. Interpretation of the data or analysis is at the reader's own risk. Straits Index (M) Sdn Bhd reserves the rights but obligations to update, admen, or even terminate the materials. 重要声明:以上的内容由海峡指数(马)私人有限公司提供,纯粹是教育性质, 并不是任何的投资忠告。所有资料显示认为是准确和可靠的。对数据或分析的解释和用途是在于用户自己的风险。海峡指数(马)有限公司持有保留及义务更新,甚 至终止材料的权利。


Source : WinChart, Straits Index (M) Sdn Bhd http://www.straitsindex.com/

Should you take profit during a Technical Correction?

The KLCI had a technical correction, breaking below the T2 uptrend line which lasted for 3 months as well as breaking below the Bollinger Middle Band. As a result, many counters are having technical correction with price falling down to 30%, is this a signal for profit taking? If price should rebound after being over-sold in a sharp technical correction, should investors speculate in this short term rebound? What about investing for trend?


Chart 1: KLCI chart breaking T2 uptrend line.


Chart 2: KNM - 7164, chart from 4/3/2009 to 265/6/2009.

Is it too late to take profit now?

Many beginner investors will only consider to take profit after price drop about 30%. This is because an inexperienced investor might have ignored the effect of the KLCI correction. For example, the KLCI dropped only 5% from its recent high of 1095 points in its technical correction, but many counters had dropped more than 30% in their technical correction. (Compare Chart 1 and Chart 2). It is actually too late to take profit. However, most of the time, after a sharp correction, price pull-back or rebound as a result of over-sold. For those investors who had missed the first selling signal, the rebound can be a second chance for them to take profit, but not at the same level.

These investors worried that if they had sold their position during a technical correction, and if later price continue to rally and breaking new high, and they would have missed the rally. It is possible that price could rally again, and therefore, when price should break new higher, (KLCI above 1095 with strong volume), it would be another buy signal, and investors could reposition themselves.

Should investors accumulate high dividend stocks?

When price drops, the PER of the counter will drop, and if the company is paying dividend as well, its dividend yield will also increase as a result of price drop. This might look attractive to those fundamental investors, but is it a good move to accumulate high-yield stocks during a downtrend? In fact, every investment style has their own Pros and Cons. But still, before anyone accumulate any high-yield stock, it is important to study the following factor :


Chart 3: Public Bank - 1295, chart from 22/4/08 to 31/3/2009, losing RM 5.00 or 42%.


Chart 4: KLCI chart from 22/4/2008 to 31/3/2009, losing 500 points or RM 38.6%.

As shown on Chart 3, price of Public Bank fell together with the KLCI, losing RM 5.00 or 42% between May of 2008 to March of 2009. Even though Public Bank paid out a total dividend of RM 0.55 during this period, the dividend could not cover the capital lost of RM 5.00. This clearly shows that accumulating during a downtrend, despite a high-yield stock, may not be the wisest choice of investment. A more suitable way would be to buy these high-yield stock when the KLCI rebound and reverses.

What about Contra or short term speculating?

For investors who can handle a higher short term trading risk, it is certainly an options to trade as the price rebound after an over-sold condition. However, this method is not suitable for all investors, and to trade for short term, investors have to have time to monitor the short term price swing, as well as an absolute sound short term trading plan, and if price should begin to fall, it is a signal to sell.

In addition to that, not every counter is suitable for short term trading. A counter suitable for short term trading must be liquid, and these are usually the most active counters on the board. Another criteria is its daily fluctuation, this is to make sure it fluctuates enough to yield a tradable difference of price. (Study Chart 5 and 6)


Chart 5: UEMland - 5148, intra-day chart on 22/6/2009.


Chart 6: UEMLand - 5148 chart showing an over-sold signal.

As shown on Chart 5, UEMland daily price fluctuates from its low up to 12sens. As shown on chart 6, the circle A indicates that price of UEMland has broken below the 20-day Bollinger lower band, which is an over-sold signal. Short term trader could take this opportunity to buy for a good chance of a rebound as a result of a pullback effect.

The rule of thumb for short term trading is to cut loss or take profit as price turns south. It is absolutely crucial that short term investors must have a strong trading mindset and should always stick to their strict rule of trading. Most often, when price begin to fall and many short term investors find it difficult to cut loss or they had missed their profit taking signal, and as a result, they hold on to the stock, changing their mindset from short term trading to long term holding. Most likely, this will result in suffering huge losses.

Breaking even? Your last choice.

When investors begin to lose money, their confident is lower, thus changing their original trading objective from making money to breaking even. Therefore, all losers who are holding in losses, have nothing but only hopes, not hopes to make money, but a pathetic hope just to break even! Instead of learning how to break-even, why not avoid it buy properly applying a Trailing Stop method when buying any stocks? For example, using uptrend line, 14, 21, 31 EMA, Bollinger middle band, chart patterns like Ascending Wedges, or even the Weekly MACD histogram signal to spot for warning signals.

For trend trading, this might not be the best time to invest, because the broad market is still only having a technical rebound after a sharp correction. Unless the market volume should pick up and stay above the 40-day Volume Moving Average and the re-expansion of the Bollinger Bands width with the KLCI above the middle band; only then, the KLCI might have a chance to regain its strength and it could resume its uptrend.

Nevertheless, investors should honor their trailing stop method, and cut loss or take profit as price break below the uptrend line. Failing to act upon the trading plan will result in huge losses.


Chart 7: DRBHCOM - 1619, chart from 1996 to recent.

As shown on Chart 7, price of DRBHCOM once touched RM 10.20 in November 1996, but until now, it has never returned to the same level, after so many years, not to mention that in between this period, our local market has gone through a few bull runs, namely the 1999, 2003, and 2007, and the 2008 peak of 1524.69 points. Despite the bull runs, price of DRBHCOM failed to return to its peak, not even half of it. From 1997 till now, DRBHCOM had paid a total dividend of RM0.353 sen. However, the dividend received is nothing comparing to the capita lost.

Conclusion:
The recent technical rebound has different meaning to different investors. For those who are looking for trend investing, this might not be the best timing yet, so as the long-term high-yield investors. However, for short term traders, this might be a trading opportunity, but short term investors must have a strong trading mind-set, and be ready to close position if price should begin to fall. Never change the mind-set of short term trading to long term investing when price should form a downtrend. In short, when price breaks below an uptrend, it is always wise to take profit, for you can always buy back the shares when price should break above the downtrend line in the future.


Copyright © 2009 Straits Index (M) Sdn BhdImportant Disclaimer:These content provided by Straits Index (M) Sdn Bhd is solely for education and information purposes only, and do not suggest any investment advices. All information displayed are believed to be accurate and reliable. Interpretation of the data or analysis is at the reader's own risk. Straits Index (M) Sdn Bhd reserves the rights but obligations to update, admen, or even terminate the materials. 重要声明:以上的内容由海峡指数(马)私人有限公司提供,纯粹是教育性质, 并不是任何的投资忠告。所有资料显示认为是准确和可靠的。对数据或分析的解释和用途是在于用户自己的风险。海峡指数(马)有限公司持有保留及义务更新,甚 至终止材料的权利。


Source : WinChart, Straits Index (M) Sdn Bhd http://www.straitsindex.com/

Identify Reversal Pattern, taking profit at the right time.

After resisted at 1100 level, the KLCI started its technical correction, breaking below the T2 uptrend line (refer to chart 1), ended the uptrend which started since March, 2009. As the KLCI ending its uptrend, many individual stocks are also reversing, while forming Ascending Wedge. With many counters begin to reverse, should investors take profit? What about the next entry point? How should one find the next buying signals?

Chart 1: KLCI chart from 25/02/09 to 18/06/09.


Chart 2: Gamuda, from 30/01/07 to 16/10/07.

To further understand the effect of Wedge, let us review an example of Ascending Wedge in Gamuda in the year 2007.

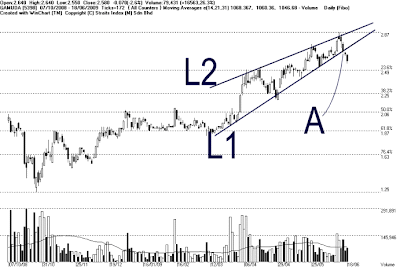
As indicated by A, price of Gamuda formed a higher-low, which is a buy signal (RM 6.70) while using the L1 line as the trailing stop reference. An Ascending Wedge is formed by an uptrend support line (L1) and a resistance line (L2). Notice as price advance and towards the tip of the Ascending Wedge, the upside volatility of the price is gradually declining, suggesting an uptrend is weakening. This usually suggests that the uptrend is coming to its end.

As indicated by B, price of Gamuda broke below L1 uptrend line, ended its L1 uptrend, which is a sell signal. (RM 8.50). Afterward, price formed a T1 downtrend line (which lasted for 3 months). As indicated by C, price dropped from RM 8.50 to RM 5.70 during the T1 downtrend. If an investor could identify the Ascending Wedge and planned for his or her exit, he or she could had avoided the T1 downtrend. Because, even if one should bought at level A, but failed to exit at B, he would have lost all this paper profit.

Generally, most stock price fall after breaking below the Ascending Wedge, but under special circumstances like special positive announcement from a company or during a bullish broad market, stock price might not form a downtrend but will only consolidate. Therefore, investors could get ready again and be prepared for the next entry if a proper buy signal appears. (Study Chart 3).


Chart 3: Gamuda, from 30/01/07 to 16/10/07.

As indicated by D, price of Gamuda broke above the T1 downtrend line, which is a buy signal. Price pulled-back after the break out, but supported by the 14, 21, 31 EMA, which served as the dynamic support, and therefore, confirming the buy signal. Price of Gamuda was supported by the 14, 21, 31 EMA, and the rally lasted for 3 months, while the 14,21, 31 EMA being the trailing stop reference.

Now, after 2 years, price of Gamuda is forming an Ascending Wedge again. For those who are still holding its share, when is the time to take profit? As for those who are waiting to buy, when will be the best entry signal?

Case Study No1: Gamuda.

Chart 4: Gamuda, from 22/10/08 to 18/06/09.

As shown on Chart 4, price of Gamuda started rising in October, 2008, and as the broad market started to form an uptrend, price of Gamuda picked up its speed, by forming an new and steeper uptrend (L1), which lasted for 3 months. Since the rally of October, 2008, price of Gamuda had risen up to 128%. Nevertheless, other than the L1 line, price of Gamuda also form an L2 line, which is the dynamic resistance of the Ascending Wedge.

Based on the formation of the Ascending Wedge, the upside room of the Ascending Wedge is getting smaller as the upside fluctuation is gradually reducing; this suggests that the uptrend is getting weaker, and a reversal is likely to take place. As indicated by A, price of Gamuda broke below the L1 uptrend line, ended its L1 uptrend, and started its technical correction.

Generally, a pull back (rebound) is likely to take place after price break below the L1 line. If price should be resisted by the L1 after a possible pull-back, it would confirm the end of the L1 uptrend, thus a signal suggesting to take profit, as the risk of forming a downtrend is high. Resistance for Gamuda is at RM 2.87, while the supports are found at RM 2.47, RM 2.35 followed by the RM 2.22 WinChart Automatic Fibonacci Retracement line.

With the KLCI having its technical correction after breaking below its T2 uptrend line, many individual stocks are also forming Ascending Wedge. Below are a few more examples of Ascending Wedges:

Ascending Wedge Example 2: Zelan - 2283:

Chart 5: Zelan, from 25/02/09 to 18/06/09
Resistance: RM 1.12 WinChart Automatic Fibonacci Retracement line.
Support(s): RM 0.86 and RM 0.78 WinChart Automatic Fibonacci Retracement line.

Ascending Wedge Example 3: OSK - 5053:


Chart 6: OSK, from 25/02/09 to 18/06/09
Resistance: RM 1.55 WinChart Automatic Fibonacci Retracement line.
Support(s): RM 1.25 and RM 1.20 WinChart Automatic Fibonacci Retracement line.

Ascending Wedge Example 4: Unisem - 5005:

Chart 7: Unisem, from 25/02/09 to 18/06/09
Resistance: RM 1.44 WinChart Automatic Fibonacci Retracement line.
Support(s): RM 1.2 and RM 1.05 WinChart Automatic Fibonacci Retracement line.

Conclusion:
Generally, whenever a stock price is turning bullish or bearish, some form of patterns will appear. Due to the KLCI (broad market) having its technical correction, many individual counters are likely to form reversal patterns, and Ascending Wedge is one of the reversal patterns. If one should correctly indentify these Ascending Wedges, he or she could take profit at the most suitable timing and avoid unnecessary risk.


Copyright © 2009 Straits Index (M) Sdn BhdImportant Disclaimer:These content provided by Straits Index (M) Sdn Bhd is solely for education and information purposes only, and do not suggest any investment advices. All information displayed are believed to be accurate and reliable. Interpretation of the data or analysis is at the reader's own risk. Straits Index (M) Sdn Bhd reserves the rights but obligations to update, admen, or even terminate the materials. 重要声明:以上的内容由海峡指数(马)私人有限公司提供,纯粹是教育性质, 并不是任何的投资忠告。所有资料显示认为是准确和可靠的。对数据或分析的解释和用途是在于用户自己的风险。海峡指数(马)有限公司持有保留及义务更新,甚 至终止材料的权利。


Source : WinChart, Straits Index (M) Sdn Bhd http://www.straitsindex.com/

How the Dow affect our stock market?

We had mentioned earlier that the 200-day MA is a simple indicator differentiating the Bull / Bear market; also, the importance of the Dow Jones Industrial Average which affects the performance of the regional markets. Currently, the Dow is testing its 200-day MA; if the Dow should break above the 200-day MA successfully, what would it do to the regional market? Conversely, what will happen if the Dow should failed to break above the 200-day MA and started to retreat?


Chart 1: DJI chart, from 27/3/2008 to 10/6/2009 with 200-day MA.

As indicated by A, the DJI rebounded strongly in March 2009, until now, it has gained about 2300 points or 35%. As the DJI rebound, markets across the globe also rebounded strongly. For example, the Hong Kong Hang Seng index up about 7000 points or 61%, Tokyo Nikkei 225 index up 2750 or 38%, while the KLCI up 230 points or 27%.

The strong rebound of the DJI has brought a mini bull run to Asian markets with the Hang Seng index, Nikkei 225 index, as well as the KLCI breaking above the 200-day MA. However, as indicated by B, the DJI is only testing the 200-day MA.

As the KLCI broke above 200-day MA, entering a mid term bull run (Study Chart2), many individual stocks also broke above 200-day MA, for instance, Genting, which we had mentioned earlier. (Study Chart 3).

Generally, the performance of the DJI has a great effect over the other markets across the globe. If the DJI should remained resisted by the 200-day MA and begin to retreat afterward, it would have a negative effect to the regional markets. Therefore, this is a crucial moment for the DJI; and many fund managers, analysts, and investors are watching the DJI testing its 200-day MA.


Chart 2: KLCI chart from 04/12/2008 to 11/06/09, with 200-day MA.

As indicated by A, the KLCI rebounded in March, 2009, in line with the DJI rebound, and broke above the 200-day MA on the 21st of April (Indicated by B), breaking away the downtrend which lasted for 14 months. Soon, the KLCI retreated due to profit taking activities but it managed to rebound from the 200-day MA, as indicated by C, and confirmed the break out of the 200-day MA, entering a mid term bull run. Although until now, the KLCI only gained 16% after breaking above 200-day MA, many individual counters has risen 30% level.


Chart 3: Genting [3182], chart from 07/01/2009 to 10/06/09, with 200-day MA.

As indicated by A, Genting rebounded from RM 3.08 level in March, gaining 31.8% and precisely resisted by the 200-day MA. After consolidating for about 1 week, it managed to break above the 200-day MA, gaining another RM 1.50 or 33%.

Current Case Study of 200-day MA : Pelikan

Chart 4: Pelikan [5231], from 21/10/2008 to 11/06/2009, with 200-day MA.

As shown on chart 4, Pelikan has rebounded RM 0.83 or 135% since March, and now testing the 200-day MA. As indicated by A, this is the first time Pelikan is testing its 200-day MA since November of 2007.

Because it is only a first day break out of the 200-day MA, the break out is yet to be confirmed. Generally, price pull back after breaking above a major resistance like 200-day MA. If price should remain supported by the 200-day MA after its pull back, then it would be a confirmation of a break out from the downtrend which lasted for 19 months. Next resistance for Pelikan is at RM 1.60 and RM 1.80 WinChart Automatic Fibonacci Retracement.

For those who are holding Pelikan shares, or those who are thinking of buying, the 14, 21, 31 EMA is still serving as the dynamic support, and investors can apply the 14, 21, 31 EMA as the trailing stop method. If price should break below 14, 21, 31 EMA, it would be a signal to take profit or to cut loss.

Here are some fundamental information of Pelikan:
Table 1:
Quarterly Earning per Share (Sen):

2007 2008 2009
Quarter 1 Quarter 2 Quarter 3 Quarter 4 Quarter 1 Quarter 2 Quarter 3 Quarter 4 Quarter 1
14.81 15.24 7.98 -3.62 8.32 15.26 5.43 -13.44 2.36

Dividend and Dividend Yield:

Dividend: Dividend Yield Net Profit Ratio
2008 2 sen 2.06% 3.15%
2007 11 sen 2.76% 7.79%
2006 15 sen 4.08% 11.73%
2005 12 sen 5.88% 11.37%

Based on the closing price of RM 1.44:

Price Earning Ratio 15.25 times Dividend Yield 1.39%

Below are some counters which is testing the 200-day MA. If price should break above the 200-day MA, with substantial volume, it would be a buy signal, and the 14, 21, 31 EMA shall serve as the dynamic support and the Trailing Stop reference.

Code Name Board / Sector
2283 ZELAN Main Board / Construction (C.I. Component)
0082 GPACKET Main Board / Technology
1538 BOLTON Main Board / Properties
0021 GHLSYS Main Board /Technology
5274 HLCap Main Board / Finance

Conclusion:
The performance of the DJI will inevitably affect the regional markets. Now fund managers, analysts are watching closely if the DJI could break above the 200-day MA successfully. Should the DJI failed to break above the 200-day MA and started to turn weak, it would eventually pull down the regional markets, including our local stocks.


Copyright © 2009 Straits Index (M) Sdn BhdImportant Disclaimer:These content provided by Straits Index (M) Sdn Bhd is solely for education and information purposes only, and do not suggest any investment advices. All information displayed are believed to be accurate and reliable. Interpretation of the data or analysis is at the reader's own risk. Straits Index (M) Sdn Bhd reserves the rights but obligations to update, admen, or even terminate the materials. 重要声明:以上的内容由海峡指数(马)私人有限公司提供,纯粹是教育性质, 并不是任何的投资忠告。所有资料显示认为是准确和可靠的。对数据或分析的解释和用途是在于用户自己的风险。海峡指数(马)有限公司持有保留及义务更新,甚 至终止材料的权利。


Source : WinChart, Straits Index (M) Sdn Bhd http://www.straitsindex.com/

Stock picking during a consolidation.

Generally, it is quite difficult to pick stock during a bear run, which we had covered an article on "choosing the market leader" some times ago. During an uptrend correction, how should one pick stock?


(Chart 1): KLCI weekly chart.

As shown on Chart1, the KLCI rose over 200 points or 26% since March, 2009, and based on the weekly chart analysis, the current resistance for the KLCI is at 1077 WinChart automatic Fibonacci Retracement line (38.2% retracement). As indicated by A, the weekly Bollinger Bands width is contracting 7%, suggesting that the KLCI is likely to consolidate.

As indicated by B, the Weekly MACD histogram of the KLCI started to turn lower, suggesting a formation of a Rounding Top, which is a signal of a consolidation. Based on a computerized simulation, the KLCI would have to break above 1085 in order to violate the Rounding Top signal. In other words, the KLCI is now in consolidation, and how would investors pick stock during this period?

Since the rally started in March, 2009, many market leaders are not starting to consolidate, namely Lionind 4235, Equine 1147, MRCB 1651, ECM 2143, KUB 6874, and many more. These counters are forming consolidation patterns such as the contraction of the Bollinger Bands, Double Tops, and Triangles.

Example 1: Lionind.

Chart 2: Lionind [4235] chart from 11/02/2009 to 04/06/2009.

As shown on chart 2, price of Lionind hit is resistance at RM 1.50, and started its technical correction, and then entered a consolidation stage forming the L1 short term dowtrend line. However, this does not mean that the uptrend of Lionind is immediately over, it is only a consolidation of an existing uptrend.

By using 14, 21, 31 EMA, together with the L1 descending line, one shall notice that price fluctuation is getting narrower, and this is an effect of a consolidation similar to the Symmetrical Triangle.

As indicated by A, if price of Lionind should break above the L1 line successfully, it would suggest an end of the consolidation and the resume of its existing uptrend. Afterwards, investors could apply the 14, 21, 31 EMA as the uptrend trailing stop reference, and the next important resistance is at RM 1.50. On the other hand, if price should break below the 14, 21, 31 EMA, it would be a signal suggesting an end of its uptrend, and therefore, investor might want to consider to take profit or to cut loss. Support below the 14, 21, 31 EMA is at RM 1.10 level.

Of course, some investor may choose to buy before a valid break out above the L1 line, this is because if price should really break out above the L1 line, those who managed to buy earlier during a consolidation might get a bigger profit for they had bought at a better price. However, there is a risk of a downside break out of a consolidation.


Chart 3: Lionind [4235] chart from 13/08/2008 to 08/07/2008.

As shown on the chart 3, price of Lionind rallied from RM 1.35 to RM 3.10, and then consolidated by forming a Symmetrical Triangle. After consolidated for about 1 month, price of Lionind broke below the dynamic support of the Symmetrical Triangle, ended its uptrend.

Example 2: MRCB

Chart 4: MRCB [1651] chart from 02/12/2009 to 05/06/2009.

As shown chart 4, MRCB formed an Ascending Triangle pattern, suggesting its uptrend has met a strong resistance at RM 1.38 level. Again, this does not mean that the uptrend is over, it is merely another form of a consolidation during an existing uptrend. If there are any positive news or new buying interest which push the price to break above L1 line, it would be a bullish breakout, and the uptrend could resume, thus a buying signal.

As indicated by A, if price of MRCB should break above the L1 resistance with substantial volume, it is a buy signal. Afterwards, the T1 uptrend line shall continue serving as the dynamic support as well as the reference level for trailing stop method. Next resistance for MRCB is at RM 1.45 WinChart Automatic Fibonacci Retracement line.

On the other hand, if price should remained resisted by L1 line, there is a risk of forming a Double Top. A typical characteristic of a Double Top is that the volume at the 2nd Top is lower than the 1st top. If price should start to retreat and break below the T1 line, it would be an end of the uptrend, which is a signal for profit taking or cut loss.


Chart 5: Hiaptek [5072] chart from 09/12/2003 to 25/05/2004.

As shown on chart 5, Hiaptek met is resistance at RM 1.18 after its uptrend, and entered a consolidation stage by forming an Ascending Triangle. However, after consolidated for about 2 months, price dropped below the dynamic support line of the Ascending Triangle, ended its consolidation and reversed its trend.

Based on the above two examples, if investors should buy before a valid break out, there is a risk of a trend reversal and therefore, it is crucial to apply a proper trailing stop method.

Current stocks with consolidation pattern:

Code: Name: Pattern:
1147 Equine Symmetrical Triangle
3417 E & O Symmetrical Triangle
6874 KUB Symmetrical Triangle
2143 ECM Double Top

Conclusion:
A healthy uptrend should have consolidation, and most likely will form patterns such as Double Top and Triangles, suggesting that the stock price is preparing for the next movement. When price break above the resistance line of a Triangle or a Double Top, it is a buy signal, provided with substantial volume. Conservative investors should not buy too early during the consolidation for there is a risk of a downside break out of the consolidation triangle. Further more, it is only logic to trade with the direction of the trend.


Copyright © 2009 Straits Index (M) Sdn BhdImportant Disclaimer:These content provided by Straits Index (M) Sdn Bhd is solely for education and information purposes only, and do not suggest any investment advices. All information displayed are believed to be accurate and reliable. Interpretation of the data or analysis is at the reader's own risk. Straits Index (M) Sdn Bhd reserves the rights but obligations to update, admen, or even terminate the materials. 重要声明:以上的内容由海峡指数(马)私人有限公司提供,纯粹是教育性质, 并不是任何的投资忠告。所有资料显示认为是准确和可靠的。对数据或分析的解释和用途是在于用户自己的风险。海峡指数(马)有限公司持有保留及义务更新,甚 至终止材料的权利。


Source : WinChart, Straits Index (M) Sdn Bhd http://www.straitsindex.com/

Continuation of Bollinger Bands Signals, and preparation during the contraction of the Bollinger Band width.

During an uptrend, price usually can not continuously going higher without having a healthy consolidation or correction. During a consolidation the Bollinger Band width contracts, and when the Bollinger Band width re-expands with price above the Bollinger Middle Band, it is a signal suggesting a resume of the uptrend. Recently, since March 2009, the KLCI Bollinger Bands bullish signals appeared 3 times, and similarly, most counters (especially the index components) also had 3 times bullish Bollinger Bands signals. (Study Chart 1).

At the moment, the KLCI is consolidating with the Bollinger Band width contracting. Will other counters consolidate like the KLCI, and what will happen after the consolidation? How should investors be prepared for the next movement after this consolidation? Let's study a few examples in detail, while we wait for the "green light" from the Bollinger Bands.


Chart 1: Scomi [7158] Technical chart from 4/2/2009 to 29/5/2009.

Indication Description:
A The Bollinger Band width re-expanded on 23/3/09, (expanded 66%), with the price of Scomi above the Bollinger middle band, and therefore, a bullish signal suggesting more upside movement biased. After that, price of Scomi consolidated again, but was supported at the Bollinger middle band.
B After consolidating for around 1 week, the Bollinger Band width re-expanded again on 13/4/09, while price was still above the Bollinger middle band, with substantial increase of volume. Therefore, this was another bullish signal for Scomi. Soon, price consolidate again but still supported by the Bollinger middle band, suggested that the price was still trending up.
C On 6/5/09, the Bollinger Band width expanded 34%, with price above the middle band with strong volume, and therefore, yet another bullish signal for Scomi. The strong volume suggested more inflow of fresh capital, thus the buying interests was stronger.
D Since arrow C, price of Scomi has gone up 60%, and reached a resistance at RM0.80 level; price started to correct then, as the Bollinger Bands contract, suggesting a consolidation for Scomi.
Other suggesting a consolidation, the contraction of the band width also implies that price of Scomi is now preparing for a new movement, and the direction of the new movement shall only be revealed when the Bollinger band width re-expands. If the Bollinger bands should expand with the price above the Bollinger middle band, it would be another bullish biased movement; if the Bollinger should expands with price below the Bollinger middle band, it would be a bearish biased movement.


Chart 2: KNM [7164] Technical chart from 4/2/2009 to 29/5/2009.

Indication Description:
A 23/3/09, the Bollinger band width expanded 30%, with the price of KNM above the Bollinger middle band; therefore, a bullish biased signal. Despite some pullback, price of KNM remained supported at the Bollinger middle band.
B Bollinger expanded again with price of KNM above the Bollinger middle band. Together with the increased of volume, this suggested another bullish biased movement for KNM.
C After a quick consolidation, the Bollinger band width expanded 82%, while price of KNM was still above the Bollinger middle band with substantial volume, therefore, breaking above the RM0.595 resistance, and marked a new high. Price rose about 30% and hit its resistance at RM0.855 level, and then, the Bollinger band width started to contract, suggested that price of KNM was to consolidate again.
D As indicated by B, the Bollinger band width of KNM re-expanded after consolidating for over 1 week, with strong volume, and breaking above the RM0.855 resistance.
Therefore, this is another bullish biased signal suggesting that KNM is resuming its uptrend. Provided that the Bollinger is still expanding with the price being supported by the Bollinger middle band, the upside biased movement is expected to continue.


Chart 3: UEMland [5148] Technical chart from 4/2/09 to 29/5/09.

Indication Description:
A Price of UEMland broke above the T1 downtrend line on the 23/3/09, together with the Bollinger band width expansion, therefore, it suggested that the downtrend has ended and price started to reverse. Despite a quick pullback, price of UEMland rebounded from the Bollinger middle band and T1.
B On 13/4/09, the Bollinger band width expanded significantly with price of UEMland above the middle band. On the same day, volume also increased substantially, suggested some inflow of fresh capital, thus confirming the bullish biased movement signal.
C On 29/4/09, the Bollinger band width re-expanded again after its contraction, with price of UEMland remained above the Bollinger middle band, thus another bullish biased movement signal. Price resumed its uptrend, broke new high.
D After a consolidation for about 1 week, the Bollinger band width re-expanded 28% on the 22/5/09 with price of UEMland remained above the Bollinger middle band, together with strong volume, and as a result, price rose sharply but resisted at RM 1.70 level.
As of 29/5/09, despite the intra-day price of Friday touched all the way to RM 1.75, it failed to close above RM1.70. Therefore, resistance for UEMland is still at RM1.70. Although the Bollinger band width is still expanding, the rate of expansion is insignificant, and therefore, this suggests that the Bollinger bands might be contracting soon, thus suggesting another consolidation for UEMland.
If the Bollinger Bands width should re-expanded significantly with the price of UEMland above the middle band, it would be another bullish biased signal, suggesting a resume of the uptrend. On the other hand, if the Bollinger band width should re-expand with the price of UEMland below the middle band, it would be a bearish biased movement signal for UEMland.

Here are a few more stocks with the Bollinger Bands contracting:

Code Name Bollinger Band Width Price Above / Below the Middle Band.
3417 E&O Contracting Below
4235 Lionind Contracting Above
7206 Ramunia Contracting Below
1155 Maybank Contracting Above
1147 Equine Contracting Below
1961 IOIcorp Contracting Above
5398 Gamude Contracting Above

The above stocks are consolidating. If the Bollinger band width should re-expands, then the new movement should be determined by the price position above or below the middle band. It is very important for investors to consider if any of the above stocks are suitable for different types of investors before investing.

Conclusion:
It is crucial to know that when the Bollinger band contracts, it suggests a consolidation as well as a preparation of a new movement. However, investors should never attempt to buy on weakness during the consolidation for if the Bollinger band should expand with price below the middle band, there will be risk more downside biased movement.


Copyright © 2009 Straits Index (M) Sdn BhdImportant Disclaimer:These content provided by Straits Index (M) Sdn Bhd is solely for education and information purposes only, and do not suggest any investment advices. All information displayed are believed to be accurate and reliable. Interpretation of the data or analysis is at the reader's own risk. Straits Index (M) Sdn Bhd reserves the rights but obligations to update, admen, or even terminate the materials. 重要声明:以上的内容由海峡指数(马)私人有限公司提供,纯粹是教育性质, 并不是任何的投资忠告。所有资料显示认为是准确和可靠的。对数据或分析的解释和用途是在于用户自己的风险。海峡指数(马)有限公司持有保留及义务更新,甚 至终止材料的权利。


Source : WinChart, Straits Index (M) Sdn Bhd http://www.straitsindex.com/

Bollinger Bands, the trend indicator.

Bollinger Bands is a primary indicator being widely used in Technical Analysis. Its signals are usually more reliable than secondary indicators such as MACD, RSI or Stochastic, but still chart patterns analysis is still the priority of Technical Analysis. Bollinger Bands indicates whether price movement is consolidating, trending up or trending down.

In other words, investors must understand the usage of Bollinger Bands especially to find out the first entry point after a consolidation, or to decide to stay on the sidelines when the Bollinger Bands width is contracting. Nevertheless, we shall cut the theory part and straight to the point with examples.

Upside biased Bollinger Bands signal:

Chart 1: TA [4898] technical chart from 24/02/2009 to 8/05/2009.

As indicated by A, TA price moved sideways with low volatility, and as a result, the Bollinger Band width contracted, suggested that price is consolidating. In other words, it also means that price is preparing for a new trend. As indicated by B, the Bollinger Band width expanded with price of TA above the Bollinger middle band, therefore, suggesting an upside biased (Bullish) signal. However, at that time, volume did not increased substantially, and therefore, it has failed to confirm the bullish Bollinger bands signal. Nevertheless, the Bollinger band width expanded again after two weeks, with the price above the middle band, as indicated by C. This time, as indicated by D, volume increased significantly, and therefore, the bullish Bollinger Bands signal was much more reliable, because the increased of volume suggested more inflow of fresh buying interests, which helped to sustain the uptrend. Afterward, the Bollinger Bands continue to expand, while price of TA continue its upside movement.

Downside Biased Bollinger Bands signal:

Chart 2: Sime [4197] technical chart from 15/05/2008 to 18/07/2008.

As indicated by A, the Bollinger Band width contracted, which is caused by the low volatility of price while moving sideways, suggested a consolidation and preparing for a new movement. It is important to note that the direction of the new movement shall only be revealed when the Bollinger Band width re-expands. After consolidated for about 2 weeks, the Bollinger Bands expanded, with price below the Bollinger middle band (as indicated by B). Therefore, the Bollinger bands has signaled a downside biased movement for Sime. Afterward, the Bollinger band width continue to expanded while price of Sime continue its downtrend.

From the above two examples, we can clearly see the characteristic of the Bollinger Bands. Whenever the band width contracts, it suggests a consolidation, when the band width expands, it suggests a beginning of a new trend, and the direction of trend shall be determined by the price above or below the middle band.

Generally, signals of the Bollinger Bands are reliable, but there are a few important conditions in order to use Bollinger Bands effectively:

1. Whenever the Bollinger Bands indicates an upside biased signal, it should be confirmed with significant increased of volume.
2. Before any expansion, the Bollinger Bands is best to have an obvious contraction. Therefore, the best time to monitor the Bollinger Bands would be during its contraction.
3. Follow the overall market trend. If the Bollinger Bands signal of an individual counter could match the broad market movement, the signals are usually more reliable.

An example of Bollinger Bands signal in the present: Maybank Berhad.

Chart 3: Maybank [1155] technical chart from 23/10/2008 to 22/05/2009.

As indicated by A, Maybank price formed a Higher-low, which was an important reversal signal that we mentioned earlier in previous article of finding the market leaders. As a result of the higher-lower formation, price of Maybank trended up and broke above RM5.00 resistance. As indicated by B, after breaking above RM 5.00 level, price of Maybank managed to consolidate above RM 5.00 and therefore, the RM5.00 is the current support. Currently, the Bollinger Bands is contracting, suggesting the Maybank is again preparing for a new movement.

As indicated by C, price of Maybank rebounded from the Bollinger middle band on the 20th of May, up RM0.25 or 5%, and therefore, the Bollinger middle is the current dynamic support. If the Bollinger band should expand with price above the middle band and increased of volume, price of Maybank is expected to move higher until another contraction of the Bollinger band width, which would then suggests another consolidation.

Nonetheless, other than the Bollinger bands signal, the sentiment of the broad market is also important for it would affect the performance of Maybank. In short, if the KLCI should continue its uptrend, there is a good chance for Maybank to move higher. Resistance for Maybank is at RM 5.90 while the RM 5.00 is its current support.

Here are a few other stocks which has potential Bollinger bands signal of breaking away from their consolidation:

Code

Name Bollinger Bands Price Above or Below the middle band. Conditions for uptrend formation.

5398

Gamuda

Expanding

Above Expanding Bollinger band width, while awaiting more volume to confirm the bullish signal.

1015

AMMB

Contracting

Above Continuation of its uptrend, waiting for more volume and expansion of the Bollinger Bands.

7228

TGoff

Contracting

Above Current volume is still low, while still consolidating. Meanwhile, price is testing an important 200-day Moving Average.

5122

Kencana

Contracting

Above Might be forming another Higher-lower, awaiting Bollinger Band width to expand with increasing volume.

Conclusion:
The Bollinger band width will contract during price consolidation, and when price begins to move away from its consolidation, the Band width shall expand, therefore, giving a clear signal for investor to buy or to sell. When the Bollinger bands expands, the position of price above or below the middle band should determine the direction of the new movement.


Copyright © 2009 Straits Index (M) Sdn BhdImportant Disclaimer:These content provided by Straits Index (M) Sdn Bhd is solely for education and information purposes only, and do not suggest any investment advices. All information displayed are believed to be accurate and reliable. Interpretation of the data or analysis is at the reader's own risk. Straits Index (M) Sdn Bhd reserves the rights but obligations to update, admen, or even terminate the materials. 重要声明:以上的内容由海峡指数(马)私人有限公司提供,纯粹是教育性质, 并不是任何的投资忠告。所有资料显示认为是准确和可靠的。对数据或分析的解释和用途是在于用户自己的风险。海峡指数(马)有限公司持有保留及义务更新,甚 至终止材料的权利。


Source : WinChart, Straits Index (M) Sdn Bhd http://www.straitsindex.com/