Wednesday, September 2, 2009

Cutting Losses Early

The tough part of making money in the stock market is more than just picking the right stock at the right time, the determination to cut loss is equally, if not more, important than the entry. With the market having its technical correction, many individual counters will be having corrections as well, and therefore, this week, we shall review a counter mentioned last week, and also discuss more issues on cutting losses.


Chart 1: FBM KLCI, chart from 30/04/2009 to 20/08/2009.

As shown on Chart 1, the FBM KLCI Bollinger Bands Width finally re-expanded after contracted for 3 weeks, this suggests that the KLCI has ended its consolidation, and has begun its new movement. Unfortunately, the KLCI is now below the Bollinger Middle Band, and therefore, the immediate outlook is on the negative side. Meanwhile, the narrower the Bollinger Bands Width, the clearer the expansion signal (refer to chart 2), and therefore, the signal of the Bollinger Bands Width re-expansion confirmed the KLCI new movement.


Chart 2: FBMKLCI chart fom 2/09/2004 to 30/11/2009.

As indicated by A, the Bollinger Bands Width was very narrow, and when it re-expanded, the signal is much clearer. The re-expansion of the Bollinger Bands Width as pointed by A, with the KLCI above the Bollinger Middle Band, suggests that the consolidation has ended, and the KLCI started a new uptrend.

After cutting loss, It is perfectly alright to re-enter if the signals are positive:

Many investors are reluctant to cut losses because they are so afraid that the stock price might rebound after they had cut loss. In reality, when chart shows good signal, it makes perfect sense to re-enter as though you were buying a new stock.


Chart 3: E&O – 3417, chart from 30/04/2009 to 20/08/2009.

As indicated by A, the Bollinger Bands Width re-expanded with price above the Bollinger Middle Band, thus a bullish signal (Buy signal), with the Bollinger Middle Band being the first cut loss point. As pointed by B, price of E&O dropped below the Bollinger Middle Band and triggered the cut loss point, and therefore, investors should honor their trading plan and cut loss.

After breaking the Bollinger Middle Band as indicated by B, price of E&O did not form a downtrend. Although it resumed to above the Bollinger Middle Band, the Bollinger Bands Width has not re-expanded, thus giving no signal, until arrow C, the Bollinger Bands Width re-expanded with price above the Bollinger Middle Band.

As indicated by C, the Bollinger Bands Width signal another bullish signal, thus another buy signal, and for those investors who has just cut-loss at B, they might have missed it. But in fact, based on the signal, with the analysis of the broad market, investors (new or old) should take the signal, provided with proper cut-loss plan with the Bollinger Middle Band.

Price continued its uptrend after arrow C, while supported by the rising Bollinger Middle Band, forming an uptrend. Therefore, investors can switch to the 14, 21, 31 EMA as the dynamic support as well as the trailing stop reference. As long as the price is above the rising EMA, investors should not take profit too early.

Price to pay for not Cutting Loss:

The above Chart 3 is an example of a stock resuming its uptrend after investors cut loss. However, in reality, not all stock could resume its uptrend after a cut-loss signal, and therefore, this is a main reason why investors suffer huge losses failing to cut loss. (Study Chart 4)


Chart 4: Airasia – 5099, from 7/01/2008 to 24/06/2008.

As indicated by A, the Bollinger Bands Width re-expanded, with price of Airasia below the Bollinger Middle Band, thus signaling bullish biased signal, and investors can choose to buy with this signal, with the first cut-loss point at the Bollinger Middle Band. As indicated by B, price of Airasia fell below the Bollinger Middle Band, thus triggered the cut loss point, and investors should honor their trading plan and cut loss (RM 1.56).

As pointed by C, D, and D, the Bollinger Bands contracted and re-expanded but every time it expands, price is below the Bollinger Middle Band, thus suggesting the downtrend is still intact. If investors should failed to cut loss at arrow B, he or she would suffer a great loss by holding on their shares in the downtrend.

Cutting loss early:

No body could forecast the future movement of the market, regardless of what methods they use. One could only apply studies and analysis with statistic. One should understand the reality that investing has not perfect formula nor short-cut methods, nor any automatic stock picking softwares. Investment is personal professional business, which requires skills and experience, and lots of hard work. Therefore, investing is more than picking the right stock, it is all about trading plan.

Any reasons can cause the stock price to fall, but the only reason why investors lose money is because they never cut-loss. The highest risk in trading is not the high or low of the stock price, but not cutting loss.

Loss

% Required to break even

10%

11.11%

20%

25%

30%

42.86%

50%

100%

Table 1: Losses and percentage to break even.

As shown by Table 1, if an investor cut loss after losing 10%, he will get 90% of his remaining cash, and he could start over again when the same stock or another stock gives him the right signal to buy. If at the next trade, the stock forms an uptrend, all he needs is a gain of 11.11% to regain all his previous losses. Therefore, recovering a 10% loss is not difficult, and provided the investor has cash, there will be opportunities.

However, if one should failed to cut loss and if the loss is 50%, it will be too late. Because, if a stock price should fall 50%, it need to regain 100% just to get back to the original level. In other words, if one cut loss after losing 50%, he will only have 50% in cash, and he need to buy a stock that could rise 100% in order for him to break even. Compare 100% and 11.11%, and you shall see the reality and probabilities of winning. Reducing trading risk, is actually also increasing chances of winning.

Case Study Review: Mulpha - 3905


Chart 5: Mulpha – 3905, chart from 30/04/2009 to 20/08/2009.

As indicated by A, price of Mulpha broke below the Bollinger Middle Band, and triggered the first cut-loss point. Therefore, investors should honor their trading plan, cut loss. If one should find it hard to accept, he or she should practice “Partial Distribution” by cutting 1/3 of the capital, at least its a first step in lowering trading risk.

Conclusion:
There are always risks in investing and trading, and no one could avoid them. Therefore, we should carefully plan our maximum allowed loss before every trade, and when situation comes, executing the cut loss plan as planned and retain the major of the capital for the next investment. However, investors must carefully study the market situation, and if the market is heading down, avoid switching from stocks to stocks, the best strategy is to keep cash.


Copyright © 2009 Straits Index (M) Sdn BhdImportant Disclaimer:These content provided by Straits Index (M) Sdn Bhd is solely for education and information purposes only, and do not suggest any investment advices. All information displayed are believed to be accurate and reliable. Interpretation of the data or analysis is at the reader's own risk. Straits Index (M) Sdn Bhd reserves the rights but obligations to update, admen, or even terminate the materials. 重要声明:以上的内容由海峡指数(马)私人有限公司提供,纯粹是教育性质, 并不是任何的投资忠告。所有资料显示认为是准确和可靠的。对数据或分析的解释和用途是在于用户自己的风险。海峡指数(马)有限公司持有保留及义务更新,甚 至终止材料的权利。


Source : WinChart, Straits Index (M) Sdn Bhd http://www.straitsindex.com/

Partial Distribution (Profit Taking / Cutting Loss)


Chart 1: KLCI chart from 23/04/2009 to 13/08/2009

As shown on chart 1, the FBM KLCI Bollinger Bands Width contracted for about 3 weeks, and this shows that the KLCI is still consolidating while preparing for a new movement. Meanwhile, many individual counters are consolidating with their Bollinger Bands Width contracting. If the Bollinger Bands of the KLCI should re-expands, many counters will be having a similar signal as they will be breaking away from their consolidation. Therefore, this is a suitable time to monitor the Bollinger Bands Width. This week, we shall review some of the counters mentioned last week as well as a method to gradually reduce positions to take profit or the cut-loss.

Partial Distribution:

Generally, it is fairly simple to hold position(s) if the price of a stock should stay above the rising 14, 21, 31 EMA dynamic support. However, at some situation where the price is rising too quickly, or should investors feel uncomfortable holding their shares, they can consider partial distribution by selling a portion of their position (1/3). When they had sold a portion of their position, they will reduce pressure. Another advantage of partial distribution is when the stock price should continue to climb after you had taken profit partially, you will not be regretted as you still have a portion of your position riding with the uptrend. Although you could not sell all your stock at the highest price, you are gradually reducing your trading risk, while at the same time, executing your trading plan.

If price should break below a support level, it is time to cut-loss. However, to cut loss requires a lot of courage, and not everyone is trained to take such action, and failing to cut loss is always the biggest killer to one's portfolio. Whenever you should feel helpless and unable to cut loss, you can always consider cut a portion of your position first. The reason why most people do not cut loss is because they are afraid that price might rebound after they had cut loss. Therefore, by cutting a portion of your position, you can reduce the psychological burden of such fear. If price should continue to fall after your had cut loss, selling the remaining is no longer a difficult task as you had already accepted that the trade is not perfect. On the other hand, should price rebound after you had cut loss, you can choose to hold on the remaining shares or even buying again when price is moving higher based on the market condition.

Case Studies Review:


Chart 2: Kinstel – 5060, chart from 23/04/2009 to 13/08/2009.

As shown on chart 2, price of Kinstel broke new high on the 4th of August, but however, due to the lack of volume, it failed to rally, and instead, it was moving sideways after the breakout, entered a consolidation stage. As indicated by A, price of Kinstel fell below the Bollinger Middle Band once, but managed to rebound back to above the Bollinger Middle Band. At the moment, the Bollinger Bands Width is contracting, suggesting it is still consolidating, and the uptrend is still yet to be confirmed, but since the price has dropped below the Bollinger Middle Band before, it was a signal to cut-loss partially; if price should fall below the Bollinger Middle Band again, it would be a signal to cut loss again.


Chart 3: LBS- 5789, chart chart from 23/04/2009 to 13/08/2009.

As indicated by A, Bollinger Bands Width of LBS expanded on the 4thof August with price above the Bollinger Middle Band, and therefore, it was a buy signal with the Bollinger Middle Band being the immediate support. As indicated by B, price of LBS retreated but managed to be supported by the Bollinger Middle Band, and therefore, it has formed an uptrend. As price is forming an uptrend, it is suitable to switch to 14, 21, 31 EMA as the dynamic support as well as the Trailing Stop reference. Provided price could remain above the rising EMA, investors can choose to hold on to their position(s). If price should break below the EMA, it is a signal to take profit.


Chart 4: Axiata – 6888, chart from 23/04/2009 to 13/08/2009.

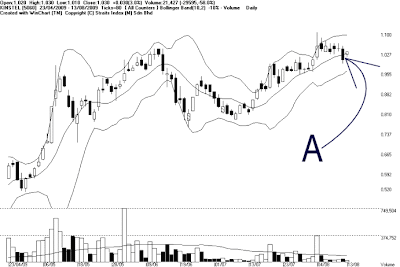
As indicated by A, the Bollinger Bands Width of Axiata expanded on the 7thof August, with price above the Bollinger Middle Band, and therefore, it was a buy signal. At the moment, the Bollinger Bands Width is still expanding with price remains above the Bollinger Middle Band, and therefore, the uptrend remains intact. Investors can apply the 14, 21, 31 EMA as the dynamic support for the uptrend as well as the guideline for trailing stops. In other words, provided that price of Axiata is above the rising EMA, investors can stay on the the uptrend, and if price should break below the EMA, it is a signal to take profit.


Chart 5: Tebrau – 1589, chart from 23/04/2009 to 13/08/2009.

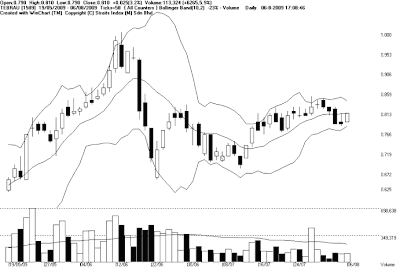
As shown on chart 5, Tebrau's Bollinger Bands Width is still contracting, suggesting that price is still consolidating while still preparing for a new movement. Therefore, investors should monitor the changes of the Bollinger Bands, and if the Bollinger Bands Width should expands with price above the Bollinger Middle Band, it would be a bullish biased signal and the consolidation would end. Other wise, if the Bollinger Bands should expand with price below the Bollinger Middle Band, it would be a bearish biased signal, and immediate outlook for Tebrau would be bearish biased.


Chart 6: Huaan – 2739, chart from 23/04/2009 to 13/08/2009.

As indicated by A, the Bollinger Bands Width of Huaan has been contracting for about a month, and finally, re-expanded on Thursday, with price above the Bollinger Middle Band. This suggests that the consolidation has ended, and price is now having a new movement. With price above the Bollinger Middle Band, the immediate outlook for Huaan is bullish biased, and therefore, a buy signal, with the first cut-loss point at the Bollinger Middle Band. If the Bollinger Bands Width should continue to expand, with price above the Bollinger Middle Band, more upside movement is expected for Huaan and the first resistance is seen at RM 0.59 level.


Chart 7: Mulpha – 3905, chart from 23/04/2009 to 13/08/2009.

As indicated by A, the Bollinger Bands Width of Mulpha re-expanded (72%) after being contracted for a period of time. At the moment, price of Mulpha is above the Bollinger Middle Band as the Bollinger Bands Width expands, this suggests that the consolidation is likely to end as the new movement is about to begin. If the Bollinger Bands Width should continue to expand, with price above the Bollinger Middle Band, it is likely that Mulpha would form an uptrend with the Bollinger Middle Band as the first cut-loss point. Resistance for Mulpha is seen at RM 0.65 level.

Conclusion:
At the moment, many counters are consolidating in line with the KLCI consolidation, and therefore, it is a good time to monitor the Bollinger Bands. When the Bollinger Bands has been contracting for a period of time, the re-expansion of the band width is usually much clearer, thus producing a clear signal. When the Bollinger Bands Width re-expands with price above the Bollinger Middle Band, it would be a positive signal, (buy signal), and if investors should choose to buy with that signal, the Bollinger Middle Band shall be the first cut-loss point. If price should advance and form an uptrend later, investors can apply the 14, 21, 31 EMA as the uptrend trailing stop reference, and when necessary, take profit partially and yet honoring the trading plan.


Copyright © 2009 Straits Index (M) Sdn BhdImportant Disclaimer:These content provided by Straits Index (M) Sdn Bhd is solely for education and information purposes only, and do not suggest any investment advices. All information displayed are believed to be accurate and reliable. Interpretation of the data or analysis is at the reader's own risk. Straits Index (M) Sdn Bhd reserves the rights but obligations to update, admen, or even terminate the materials. 重要声明:以上的内容由海峡指数(马)私人有限公司提供,纯粹是教育性质, 并不是任何的投资忠告。所有资料显示认为是准确和可靠的。对数据或分析的解释和用途是在于用户自己的风险。海峡指数(马)有限公司持有保留及义务更新,甚 至终止材料的权利。


Source : WinChart, Straits Index (M) Sdn Bhd http://www.straitsindex.com/
Finding the right timing with Bollinger Bands.

Ever since breaking above the Symmetrical Triangle on the 14th of July, the FBM KLCI has gained over 100 pts. As shown on chart 1, the Bollinger Bands Width contracted for the first after the break out of the Symmetrical Triangle, and is currently preparing for a new movement. This week, let us further study the characteristic of the Bollinger Bands and learn how to combine the Bollinger Bands Width entry signals with the Exponential Moving Average as trailing stop reference.


Chart 1: KLCI from 30/04/2009 to6/08/2009.

The expansion and contraction of the Bollinger Bands Width:

Unlike other indicators which indicate signals by the crossing between lines, the Bollinger Bands Width indicates the changes of price fluctuation by its band width, expanding and contracting.When price is moving sideways, its volatility begins to reduce, and therefore, based on the calculation of the Bollinger Bands, the band width will contract, and when it shows on the chart, investors would have a clear visual effect of the contraction, thus signaling a consolidation of the price.

Other other hand, when price fluctuation increases, the Bollinger Bands Width will expands; when shown on the chart, the expansion will indicate the end of the consolidation, thus a beginning of a new movement. However, the direction of the new movement could be upside biased or downside biased. Therefore, investors have to judge the new direction based on the position of the price above or below the Bollinger Middle Band. If price should stay above the Bollinger Middle Band when the Bollinger Bands Width expands, it is a bullish biased movement. When price should stay below the Bollinger Middle Band as the Bollinger Bands Width expands, it would be a bearish biased movement.


Chart 2: KNM – 7164, chart from 11/03/2009 to 23/06/2009.

As shown on chart 2, arrow A, B, C, and D are the signal of the Bollinger Bands Width expansion after the contraction. With price above the Bollinger Middle Band when the Bollinger Bands Width expands, A, B, C, and D are signal suggesting a bullish biased movement, thus the signal of resuming the uptrend. Investors can view these signals as a buy signal. Contrary, as indicated by E, the Bollinger Bands Width re-expanded after its contraction, but the price is below the Bollinger Middle Band, thus suggesting a bearish biased movement, this is a sell signal.

Although A, B, C, and D are all buy signals, investors who bought a D should have a different trading plan than investors who bought a A, B, or C. For investors who bought at D, they should use the Bollinger Middle Band for the immediate cut-loss point, as this will ensure a low trading risk.

As for investors who had bought at A, he or she could even top up his or her position at B, C, and D, and he or she may not use the Bollinger Middle Band as the cut-loss point for now they are having a uptrend position. Therefore, they should apply the 14, 21, 31 EMA as the dynamic support for maximize their uptrend potential or they could use and uptrend line as an alternative. However, for topping up, it is generally safer to top the same amount of value as the first entry.

Combination of the Bollinger Bands and EMA:

As the KLCI Bollinger Bands Width contracts, the KLCI is consolidating while preparing for a new movement. Many individual counters are having similar consolidation signals while also preparing for their new movement. Therefore, investors should pay close attention to these counters in which their Bollinger Bands Width is contracting. When the Bollinger Bands Width should re-expand, with price above the Bollinger Middle Band, and preferably with strongly, it would be a buy signal.

If it is the first entry (for investors who has not bought the same stock at a lower price earlier), then the Bollinger Middle Band shall be the first cut-loss point. This is to ensure if there is a sudden reversal, investors would cut-loss immediately without suffering huge loss. In other words, a valid bullish Bollinger Bands signal should have price staying above the Bollinger Middle Band, and price should not break below the Bollinger Middle Band in the near-term (in 2 or 3 days). (Study Chart 3 and Chart 4)


Chart 3: LBS – 5789, chart from 19/05/2009 to 06/08/2009.


Chart 4: Kinstel – 5060, chart from 19/05/2009 to 06/08/2009.

As indicated by A, on Chart 3 and chart 4, the Bollinger Bands Width re-expanded after being contracted, with price above the Bollinger Middle Band. Therefore, it is a signal suggesting a continuation of the rally, and the Bollinger Middle Band shall serve as the immediate cut-loss point.

Later, if price should continue to rally, and if situations allow (for example the improvement of broad markets, positive news and high volume etc), investors could apply the EMA as dynamic support as well as the reference for trailing stop, to avoid taking profit too early, and to maximize the uptrend potential while at the same time reducing trading risk.

Counters with Bollinger Bands currently contracting:


Chart 5: Axiata – 6888, Chart from 19/05/2009 to 6/08/2009.
Next Resistance: RM 3.12

Chart 6: Tebrau – 1589, chart from 19/05/2009 to 6/08/2009.
Current Resistance: RM 0.845
Next Resistance: RM 1.00


Chart 7: Huaan – 2739, from 19/05/2009 to 06/08/2009.
Next Resistance: RM 0.59

The above chart 5, 6, and 7 are counters with the contraction of the Bollinger Bands Width, as they are preparing for a new movement. However, investors should not buy until the Bollinger Bands Width expands, as this is a basic rule of investing.

Conclusion:
For every healthy uptrend, there must be consolidations and corrections, and every time the consolidation should end and resume its uptrend, it is a right time to buy. Properly applying Bollinger Bands Width would help investors to catch these signals as entry or even top up positions. For first entry, the Bollinger Middle Band could serve as the first cut-loss point. If price should continue to rally, investor should change to the 14, 21, 31 EMA as trailing stop to avoid taking profit too early while maximizing the uptrend potential.


Copyright © 2009 Straits Index (M) Sdn BhdImportant Disclaimer:These content provided by Straits Index (M) Sdn Bhd is solely for education and information purposes only, and do not suggest any investment advices. All information displayed are believed to be accurate and reliable. Interpretation of the data or analysis is at the reader's own risk. Straits Index (M) Sdn Bhd reserves the rights but obligations to update, admen, or even terminate the materials. 重要声明:以上的内容由海峡指数(马)私人有限公司提供,纯粹是教育性质, 并不是任何的投资忠告。所有资料显示认为是准确和可靠的。对数据或分析的解释和用途是在于用户自己的风险。海峡指数(马)有限公司持有保留及义务更新,甚 至终止材料的权利。


Source : WinChart, Straits Index (M) Sdn Bhd http://www.straitsindex.com/

Missing the Bull run, How?


Chart 1: Dow Jones Industrial Average, from 17/12/2007 to 29/07/2009.

As shown on Chart 1, the Dow Jones Industrial Average finally broke above the 200-day Moving Average, entering a new trend, and its likely to break away from the 19 months bear run. At the same time, stock market across the globe rallied, and the KLCI also broke above the Symmetrical Triangle, up more than 100 points. However, the recent rally of the KLCI was only accompanied by thin volume. This means that there are still many investors who are not taking part in the recent market rally, and missed this opportunity. In additional to missing the current rally, investors also having problem in selecting the right stocks, and therefore, this week, we shall discover how one should over-come the obstacles which causes him or her missing the rally.

KLCI rallied with weak volume.

Chart 2: KLCI chart from 9/04/2009 to 30/07/2009.

When the KLCI broke above the Symmetrical Triangle, it triggered a bullish signal, but the insufficient volume (below the 40-day VMA level) was the set back for the KLCI rally, suggested that the market rally was not fully participated by investors. As a result, many investors failed to take the opportunity as the market confidence was not high. Despite the lack of participation, the KLCI rose over 100 points, and marked a 12 months new high.

Over-cautious, missing the right timing.

Since March, 2009, our market entered a bull run, and many counters had rallied substantially. However, not every investors managed to take advantage of the bull run, because they were too cautious, worrying the economic condition in local and abroad, listed companies financial results and even political issues. These worries prevented investors from taking the opportunity in March, missing the best timing of investing.

It is impossible for an individual to gather all the necessary information at one time, and therefore, it was impossible for them make a proper trading decision. Actually, a sound trading plan is all an investor should need, and with a trading plan, investors can make trading decision at any given time, because the trading plan will outline the trading risk, and therefore, investors could measure the maximum risk in which they would be taking if they decide to buy any stocks. This way, instead of over worries while seeing opportunities passing by, investors can take control of these opportunities, by taking a measurable risk.

A Systematic Approach in Analysis:

Most of the time, after suffering serious losses, investors will eventually be afraid of chasing any rally, and believe that the best time to invest is when the stock price is trading at its lowest, with the best economic data, and with all positive factors. However, in reality, by the time the market is filled with positive factors, wonderful fundamental results, and best economic data, the stock market has already reaching its peak. This is because stock price and stock market usually reflects the economy and fundamental of a company 3 to 6 months earlier. Therefore, it is impossible to get a bargain. Please study table 1.

Step 1:

Broad Market Analysis (Including KLCI, Dow Jones Industrial Average, and regional indices)

 
  • Analyze chart patterns (if available), and Primary Indicators (such as Bollinger Bands and Moving Average)
  • Analyze volume to confirm any trading signals, and study Secondary Indicators for more reference.

Step 2:

Individual Counters Analysis

 
  • Study the Quarterly and Year Financial Results to identify quality stocks.
  • Analyze chart patterns (if available), and Primary Indicators (such as Bollinger Bands and Moving Average)
  • Analyze volume to confirm any trading signals, and study Secondary Indicators for more reference.
  • Trading plan: Set immediate cut-loss point, and Trailing Stops
  • Buy.

Step 3:

Apply Trailing Stops.

 
  • After buying, take the recent support or Bollinger Middle Band or EMA as the immediate cut-loss level, in case the stock price should reverse immediately.
  • As the stock price begin to rise, lift cut-loss level higher according to Bollinger Middle Band or EMA.
  • As long as the stock price is above the Trailing Stop reference (Bollinger Middle Band or EMA), keep the stocks.
  • If stock price should retreat and break below the Trailing Stop reference, take profit or cut-loss.

Table 1: Steps in Systematic Analysis and Trading Plan.

Case Studies : Lioinind 4235


Chart 3: Lionind 4235, chart from 9/04/2009 to 30/07/2009.

As indicated by A, price of Lionind broke above RM 1.50 resistance on the 28thof July, marking a new high since 10/09/2008 (10 months), triggered a buy signal. As indicated by B, after breaking new high, price of Lionind retreated as profit taking took place. However, it was supported by the RM 1.50 level, and therefore, the immediate cut-loss point is at RM 1.50. If later price of Lionind should rally, the 14, 21, 31 EMA shall serve as the dynamic support, as well as the Trailing Stop reference. As long as price is above the rising EMA, investors should consider holding their shares. If later, price should break below the 14, 21, 31 EMA, it would be a signal to take profit or cut-loss. Next resistance for Linoind are seen at RM 1.77 followed by RM2.00 level

Case Studies: UNISEM 5005


Chart 4: Unisem 5005, from 9/04/2009 to 30/07/2009.

As indicated by A, price of Unisem broke above RM 1/.53 resistance on the 26thof July, marking a new high since 21/2/2008 (17 months). Technically, this is a buy signal, with the immediate cut-loss point at RM 1.53 level. As indicated by B, price of Unisem retreated after the break out, but precisely supported by RM 1.53. Therefore, the RM 1.53 support remains intact, and it has not triggered a sell signal. If price should move higher, the 14, 21, 31 EMA shall serve as the dynamic support as well as the Trailing Stop reference.

Table 2:

Stocks currently breaking new high:

Stock Name and Code

Buy signal.

Trailing Stops.

Next Resistance

4715 – GENM

13 months New High

14, 21, 31 EMA

RM3.05 and RM3.35

8575 - SAPCRES

20 months New High

14, 21, 31 EMA

RM1.88 and RM2.00

(Note: Based on the closing price of 30/07/09)

Table 2 shows stocks which break new high, triggering a buy signal, and also the Trailing Stop reference.

Table 3:

Stocks currently testing its resistance:

Stock Name and Code

Buy signal.

Trailing Stops.

Next Resistance

3417 – E&O

Testing RM1.20 Resistance

14, 21, 31 EMA

RM1.45

4898 – TA

Testing RM1.20 Resistance

14, 21, 31 EMA

RM1.30 and RM1.54

5060 - Kinstel

Testing RM1.04 Resistance

14, 21, 31 EMA

RM1.19 and RM1.39

(Note: Based on the closing price of 30/07/09)

Table 3 shows stocks now testing their resistance, and potential buy signal when breaking new high, with trailing stop reference.

Conclusion:
There will be risk in investing, and no body can be sure of getting a winning trade every time. In reality, stock investment is far more difficult than those described in advertisements. Knowing that some risk is unavoidable, investors must learn to construct his or her trading plan, setting a cut-loss or contingency plan in case things do not work out as planed, and when time is not right, investors should take defend by holding cash, not shares. In short, when you have a prepared cut-loss plan, you can find trading opportunity at any time.


Copyright © 2009 Straits Index (M) Sdn BhdImportant Disclaimer:These content provided by Straits Index (M) Sdn Bhd is solely for education and information purposes only, and do not suggest any investment advices. All information displayed are believed to be accurate and reliable. Interpretation of the data or analysis is at the reader's own risk. Straits Index (M) Sdn Bhd reserves the rights but obligations to update, admen, or even terminate the materials. 重要声明:以上的内容由海峡指数(马)私人有限公司提供,纯粹是教育性质, 并不是任何的投资忠告。所有资料显示认为是准确和可靠的。对数据或分析的解释和用途是在于用户自己的风险。海峡指数(马)有限公司持有保留及义务更新,甚 至终止材料的权利。


Source : WinChart, Straits Index (M) Sdn Bhd http://www.straitsindex.com/

Second Board and Main Board Merging, Second Board Treasure Hunt.

The FMB 2ndBoard will be merging with the Main board on the 3rdof August, 2009, will this benefit the market in general, or will it bring more risk for investors? This week, we shall focus on some important factors about this merging, as well as the key features in selecting 2ndboard counters.

Impression on Second Board:

During the financial crisis on 1997, many investors had suffered severe losses in stock investing, especially in investing in the Second Board counters. Many Second Board counters lost over 90% of their share price and therefore, investors who were caught by the massive loss had developed a fear towards Second Board.


Chart 1: AHB - 7315: Chart from 23/08/100 to 21/08/1998.


Chart 2: Farmbes – 9776Chart from 26/06/1996 to 30/06/1998.


Chart 3: Tanamas – 7382Chart from 8/01/1997 to 11/08/1998.

As shown on Chart 1, 2, and 3, these are counters that have relatively smaller capital, thus a target of speculation. During the market peak at the end of 1996 to beginning of 1997, many Second Board counter started falling, with losses more than 90%. When a stock price fall 90%, it require to rebound 900% in order to break even, in other words, for those investors who were holding on to their losses, breaking even is almost impossible.

Meanwhile, counters will smaller paid-up capital as well as weaker fundamental are gathered in Second Board. After the massive erosion of the 97 Asian Financial Crisis, many investors had learned to avoid Second Board counters, and as a result, the liquidity and volume of many Second Board counters reduced significantly. Therefore, these low liquidity counters are usually being filtered out by investors who apply technical analysis.

Pearls in Second Board:

Despite the negative impression that investors have on the Second Board, there are still some counters which has good fundamental listed in the Second Board, due to their relatively smaller paid-up capital. However, most investors had ignored these quality counters.

Financial Year-end

Revenue '000

Earning Per Share (sen) Dividend (sen) Dividend Yield (%)

2009, January

82,588

6

4.00

10.00%

2008, January

78,195

5

3.00

7.79%

2007, January

77,143

5

3.00

6.82%

2006, January

67,840

4

1.50

3.57%

2005, January

63,814

4

1.50

3.03%

2004, January

56,919

7

2.10

2.90%

Table 1: CYL – 7157 Financial Summary.

Financial Year-end

Revenue '000

Earning Per Share (sen) Dividend (sen) Dividend Yield (%)

2008, December

185,361

19

5.00

7.14%

2007, December

159,681

11

0.00

0.00%

2006, December

152,346

7

3.00

4.62%

2005, December

155,866

4

5.00

7.25%

2004, December

149,952

10

6.00

7.59%

2003, December

138,138

7

5.00

5.41%

2002, December

158,598

8

5.00

5.21%

Table 2Khind - 7062 Financial Summary.

As shown on Table 1 and 2, CYL and KHIND had consistent earning as well as dividend payout, this shows that the company is doing fine in terms of earning, as well as they have sufficient cash in hand, these are usually a good sign of a fundamentally strong counter. Also, their dividend yield is 7% in average, and it is higher than many of the counters listed in Main Board. The high dividend is one of the favorite feature favor to long term investors. Due to their lack of liquidity, they are ignored by most investors.

Benefit of Merging:

Firstly, fund managers will select strong fundamental counters, and previously, due to some regulation, some fund managers were not able to include counters from Second Board into their portfolio, despite the strong fundamental, now that the Second Board is merging with the Main Board, this has lifted the regulation, and therefore, those counters which has strong fundamental will benefit most from this merging as fund managers will be buying them.

Another benefit of the merging is the elimination of fear of Second Board counters. This way, investors will no long select stocks based on the listing Board, but truly on its fundamental as well as technical aspect, especially to new investors.

The above factors will improve the liquidity of good fundamental Second Board counters and eventually, improve its reliability of chart. Refer to Chart 4 and 5.


Chart 4: Kossan – 7153Chart from 5/07/2002 to 26/03/2004.

Chart 4 shows that Kossan changed from the Second Board to Main Board in August 2003. Notice how the volume has already increased 1 month before the change of listing board, and when it was listed on Main Board, the liquidity and volume has improved significantly.


Chart 5: KNM – 7164chart from 6/01/2005 to 30/09/2005

As shown on chart 5, KNM changed from Second Board to Main Board in May 2005. After listed on Main Board, its volume and liquidity improved and until now, it is frequently one of the most active counters in the market.

Negative effect of the Merging:

Although there are benefits of the merging, there is one negative effect. When the Second Board merged with the Main Board, investors are exposed to more counters which has poor liquidity as well as poor fundamental. Therefore, this has inevitably increased some risk in selecting stocks, especially inexperienced investors.

Choosing a Good Second Board counter:

Selecting good Second Board counter should begin with the fundamental. Look for counters which has consistent earning and preferably with regular dividend paid out. These counters are generally doing well in terms of earning, and if they could pay dividend on a regular basis, it implies that their debts are very well under controlled, and they have sufficient cash in hand. Therefore, these are the quality of a stock that long term investors are looking for. Study Chart 6 and Chart 7.


Chart 6: Rhythm – 7032 Quarterly Financial Summary. Chart 6 shows that this company has been making losses, consistently since 2005, and investors should avoid this kind of companies.


Chart 7: CYL Quarterly Financial Summary. As shown on Chart 7, CYL has been making consistent profit, and regular dividend payout. This kind of counters are usually the first choice of fund managers.

Despite the importance of Fundamental, it is still incomplete to just pick stock with fundamental. Investors should also consider if the volume and liquidity is sufficient for it is very difficult to trade a low liquid stocks, or investors would have to pay a much higher price to obtain sufficient shares. Therefore, the best pick is still a counter with good fundamental and good liquidity.

Conclusion:
In conclusion, for those Second Board counters which have good fundamental, the merging will definitely be beneficial, and it is likely to improve the liquidity, and eventually more potential. However, as for those Second Board counters with poor fundamental, they shall remain unchanged. There are over 1000 counters listed in Bursa Malaysia, and investors should have a reliable system or method picking counter, using Fundamental analysis to select potential counters and apply technical analysis to fine tune the trading timing.


Copyright © 2009 Straits Index (M) Sdn BhdImportant Disclaimer:These content provided by Straits Index (M) Sdn Bhd is solely for education and information purposes only, and do not suggest any investment advices. All information displayed are believed to be accurate and reliable. Interpretation of the data or analysis is at the reader's own risk. Straits Index (M) Sdn Bhd reserves the rights but obligations to update, admen, or even terminate the materials. 重要声明:以上的内容由海峡指数(马)私人有限公司提供,纯粹是教育性质, 并不是任何的投资忠告。所有资料显示认为是准确和可靠的。对数据或分析的解释和用途是在于用户自己的风险。海峡指数(马)有限公司持有保留及义务更新,甚 至终止材料的权利。


Source : WinChart, Straits Index (M) Sdn Bhd http://www.straitsindex.com/


Finding the Buy signal after a consoldiation.

After consolidating in the Symmetrical Triangle for a considerable period, the FBM-KLCI finally broke above the L2 resistance of the Symmetrical Triangle on the 14thof July, 2009, ended the consolidation which lasted for 2 months. As the KLCI breaks above the Symmetrical Triangle, many counters also break above their consolidation Triangles or short term downtrend. This week, let us find out how to spot the buy signals of a bullish break out, with volume confirmation, and how to apply a proper Trailing Stop trading plan.


Chart 1: KLCI breaking above the Symmetrical Triangle. Chart from 26/03/09 to 16/07/09.

When price breaks above the Triangle, the best confirmation would be a significant increased of volume. The rally after a breakout would only be sustainable with sufficient volume, study Chart 2.

Successful Bullish Breakout example:

Chart 2: Kinstel 5060 Chart from 10/10/08 to 8/05/09

As shown on chart 2, price of Kinstel was staying in a downtrend from November 2008 to March 2009, and the volume was mostly relatively lower during its downtrend. As indicated by A, price broke above the T1 downtrend line, but volume failed to increased significantly. Therefore, price of Kinstel pulled back after the break out, but supported by the 14, 21, 31 EMA (Exponential Moving Average).

As indicated by B, after being supported by the 14, 21, 31 EMA, volume began to increased, thus suggesting more inflow of fresh buying interests, pushing the price of Kinstel higher, forming an uptrend, and the 14, 21, 31 EMA served as the dynamic support of the uptrend. As well as the Trailing Stop reference. As indicated by C, price of Kinstel was resisted at RM 0.60 and technically corrected. However, after a brief technical correction, volume of Kinstel increased strongly as price resumed its rally, breaking above the RM 0.60 resistance, continued its uptrend.

As shown by Chart 2, volume is the most important element in sustaining a healthy uptrend. If price should break above any consolidation pattern or a downtrend line without sufficient volume, the breakout signal would be weak, and even a risk of a false breakout.

Failed Bullish Breakout Example:


Chart 3: Lionind 4235, Chart from 7/5/2008 to 6/10/2008

As indicated by A, price of Lionind broke above the Descending Triangle T1 resistance line, breaking above its consolidation. However, as indicated by B, volume did not increased significantly as price broke out above the T1 line. This shows that investors confidence about Lionind was still low, thus price only rally for a short term.

As indicated by C, price of Lionind broke below the 14, 21, 31 EMA after a brief rally, and therefore, the 14, 21, 31 EMA has resumed its role as the dynamic resistance for Lionind, the downtrend resumed.

Chart 3 shows that a bullish breakout with low volume, is usually a weak signal; it implies that the confidence level of the breakout is low, thus the lack of fresh buying interests fail to push the price higher. If volume should failed to increase after the breakout, there is a chance of a false breakout, thus price is likely to resume its previous downtrend.

Case Study No 1: Uemland 5148


Chart 4: UEMland , from 29/04/2009 to 16/07/2009

As shown on Chart 4, price of UEMland broke above the T1 line of the Descending Triangle, ended its consolidation which lasted for 1 month. After breaking above the T1 line, price also broke above the 14, 21, 31 EMA, and therefore, the 14, 21, 31 EMA is now serving as the dynamic support for UEMLand, as well as the Trailing Stop reference. In other words, provided that price of UEMLand is still supported by the rising 14, 21, 31 EMA, investors should hold on to their position. If price of UEMLand should break below the 14, 21, 31 EMA, it would be a signal suggesting an end of the currently rally, thus a sell signal. Resistance for UEMLand are seen at RM1.66, followed byRM2.00.

Case Study No 2: KNM 7164


Chart 5: KNM, chart from 10/04/2009 to 16/07/2009.

As shown on chart 5, price of KNM broke above the T1 short term downtrend line on the 14thof July, indicated a buy signal. Later, price of KNM also managed to break above the Bollinger Middle Band, with strong volume, as indicated by B, thus breaking away from the short term downtrend line which lasted for 1 month.

As circled at C, price of KNM opened with a gap up on Thursday, but resisted at the RM 0.85 level, thus giving a short term over-bought signal, suggesting a chance of a technical correction. Generally, the first target of a technical correction is at the Bollinger Middle Band, and therefore, if price of KNM should rebound above the Bollinger Middle Band after its technical correction, price is likely to resume its short term uptrend, provided that the volume could increased significantly when price rebound from the Bollinger Middle Band. However, if price should break below the Bollinger Middle Band, it would be an end to this short term rally, and the next support is seen at RM 0.705 level.

Case Study No.3: Sapcres 8575


Chart 6: Sapcres, chart from 10/04/09 to 16/07/09.

As shown on Chart 6, price of Sapcres broke above the L2 resistance of the Symmetric Triangle which lasted for 2 months on the 10th of July (indicated by A) with strong volume (as indicated by B), and started its short term rally. The 14, 21, 31 EMA is now serving as the dynamic support of the rally as well as the Trailing Stop reference.

After rallying for 4 days, price if Sapcres hit its resistance at RM 1.66, and retreated slightly, therefore, the current resistance for Sapcres is at RM 1.66. If price should continue to retreat, there is a risk of forming a Double Top, and if price should break below the 14, 21 ,31 EMA, it would end the short term rally, thus a sell signal. In other words, price must break above RM 1.66 with strong volume in order to sustain the short term rallly.

Conclusion:
Whenever price break above a consolidation pattern or a downtrend line, it is usually a buy signal, provided that volume is significantly higher at the break out day, which suggests a strong buying interests. With proper trailing stop reference as a trading plan, investors can reduce their trading risk by spotting the right time to buy and the right time to sell.


Copyright © 2009 Straits Index (M) Sdn BhdImportant Disclaimer:These content provided by Straits Index (M) Sdn Bhd is solely for education and information purposes only, and do not suggest any investment advices. All information displayed are believed to be accurate and reliable. Interpretation of the data or analysis is at the reader's own risk. Straits Index (M) Sdn Bhd reserves the rights but obligations to update, admen, or even terminate the materials. 重要声明:以上的内容由海峡指数(马)私人有限公司提供,纯粹是教育性质, 并不是任何的投资忠告。所有资料显示认为是准确和可靠的。对数据或分析的解释和用途是在于用户自己的风险。海峡指数(马)有限公司持有保留及义务更新,甚 至终止材料的权利。


Source : WinChart, Straits Index (M) Sdn Bhd http://www.straitsindex.com/

How to identify the end of consolidation?

The KLCI started its technical correction on the 12th of June, and since then, it has been consolidating, while forming a Symmetrical Triangle pattern. As the KLCI was forming the triangle, many individual counters also formed other types of triangles like Ascending and Descending Triangles.

Triangles are important patterns for not only they represent a consolidation, they also provide timing for a breakout. However, the psychology of every type of triangle is different, and we would like to analyze these types of triangles, their current consolidation and the next trading plan.

Symmetrical Triangle

Chart 1: Tranmil – 7000, chart from 13/04/2009 to 8/07/2009, Symmetrical Triangle.

As indicated by A, price of Tranmil broke above the RM 0.925 resistance on the 6thof June, with strong volume, and price rallied afterward. As indicated by B, it hit a resistance at RM 1.62, and soon retreated, but found a new support at RM 1.04 level (as indicated by C). Therefore, it formed a higher-low, and we can draw an ascending line of L1. After rebounding from L1, price of Tranmil rallied again, but this time, it failed to return to the previous RM 1.62 level, but instead, it started to retreat at RM1.40 (as indicated by D), and formed a Lower-high, thus we can draw the L2 line.

As shown on Chart 1, a Symmetrical Triangle is formed with a short term uptrend line and a short term downtrend line. As the consolidation goes on, the fluctuation of price within is getting narrower, and ready for a break out. The reason which causes the narrowing fluctuation of price is because the buyers and sellers are gradually coming to a consensus while both sides are waiting for a fresh lead. A Symmetrical Triangle carries no biased in terms of direction, for both L1 and L2 carries equal strength.

Since Tranmil is now getting towards the end of the Symmetrical Triangle, the breakout of the Triangle is expected soon. When the price is getting nearer to the tip of the triangle, it is getting closer to its breaking point. If price of Tranmil should break below the L1 line, that means the L2 downtrend line is dominating, and therefore, the downtrend is expected to continue. If price of Tranmil should break above the L2 line, it means that the L1 uptrend is dominating, thus the uptrend is resumed, but, breaking above the L2 line has to be confirmed with substantial volume. The L1 line should serve as the trailing stop reference, and the next resistance are seen at RM 1.40 followed by RM 1.60.

Ascending Triangle:

Chart 2: IOI corp 1961, chart from 20/02/09 to 08/07/09, Ascending Triangle.

As shown on chart2, since March, IOIcorp has been trending up above the T1 uptrend line. Recently, price of IOIcorp hit a resistance at RM 4.76 level. As indicated by A, price of IOIcorp remained resisted by the RM 4.76 despite a few attempts to break above it, forming the L1 resistance line. After resisted by the L1 line, price of IOIcorp begin falling while finding a support as indicated by B, suggesting the T1 uptrend is still intact. Therefore, forming an Ascending Triangle.

During an uptrend, if price should remain resisted a few times at the same level, it would form an Ascending Triangle, and therefore, during the consolidation of an Ascending Triangle, there is a slight upside biased for the uptrend remains intact. If price of IOIcorp should break above the L1 resistance line, with substantial volume, it would be a bullish breakout, suggesting a continuation of the T1 uptrend. However, if price of IOIcorp should break below the T1 uptrend line, it would suggest that the T1 uptrend has ended, thus investors should consider taking their profit.

Descending Triangle:

Chart 3: Uemland – 5148, chart from 18/03/09 to 8/07/09, Descending Triangle.

As shown on Chart 3, price of UEMLand retreated sharply after resisted at RM2.00 level (losing 35%). As indicated by B, it managed to rebound from RM 1.28 after being overly sold, and therefore, forming a support at around RM 1.30 level, indicated as L1.

After rebounding from L1, price of UEMLand rallied again but failed to return to the previous RM2.00 level, but instead, it formed a lower-high at RM 1.66 (as indicated by C), thus forming a T1 downtrend line. Therefore, it formed a Descending Triangle.

The psychology of a Descending Triangle is totally opposite to an Ascending Triangle. Because of the T1 downtrend line, there is a slightly bearish biased in Descending Triangle, for the downtrend remains intact.

If price of UEMLand should break below the L1 line, the T1 downtrend will continue, and the bearish biased movement is expected to continue. On the other hand, if price of UEMLand should break above the T1 line with strong volume, it would be a signal suggesting a break out of the downtrend, and the next resistance are found at RM 1.66 followed by RM 2.00.

Other counters forming Triangles:

Code

Short Name

Sectors

Types of Triangle

2739

HUAAN

Main Board – Industrial Product

Symmetrical Triangle

4723

JAKS

Main Board – Construction

Descending Triangle

3875

MEASAT

Main Board – Training / Service

Symmetrical Triangle

4715

GENM

Main Board – Training / Service

Symmetrical Triangle

2887

LIONDIV

Main Board – Consumer

Descending Triangle

3697

OILCORP

Main Board – Training / Service

Descending Triangle

8575

SAPCRES

Main Board – Training / Service

Symmetrical Triangle

Conclusion:
The characteristic of any Triangles is the breaking point, which gives timing of a new movement after a consolidation. Therefore, chart analysis helps investors find tune entry or exit timing, while mentally prepare for a possible breakout during the formation of triangles.


Copyright © 2009 Straits Index (M) Sdn BhdImportant Disclaimer:These content provided by Straits Index (M) Sdn Bhd is solely for education and information purposes only, and do not suggest any investment advices. All information displayed are believed to be accurate and reliable. Interpretation of the data or analysis is at the reader's own risk. Straits Index (M) Sdn Bhd reserves the rights but obligations to update, admen, or even terminate the materials. 重要声明:以上的内容由海峡指数(马)私人有限公司提供,纯粹是教育性质, 并不是任何的投资忠告。所有资料显示认为是准确和可靠的。对数据或分析的解释和用途是在于用户自己的风险。海峡指数(马)有限公司持有保留及义务更新,甚 至终止材料的权利。


Source : WinChart, Straits Index (M) Sdn Bhd http://www.straitsindex.com/